

Every trader who executes on a low timeframe knows the ritual: flip to the daily to check the trend, flip to the 4H to find the levels, flip back to the 15-minute — and by the third flip you've lost the picture you were trying to build. This indicator ends the ritual. It draws up to four higher-timeframe candle groups directly beside live price, then runs a full price-action engine on those timeframes: market structure, liquidity sweeps, price gaps, supply/demand bases, equal highs and lows, premium/discount, and previous-candle levels. One chart. No flipping.
What is the daily doing while I trade the 15-minute? Which higher-timeframe level was just run? Is my entry sitting inside an HTF imbalance — and am I buying it in premium or in discount?
Before anything else, the honest part: this is an analytical tool. It keeps higher-timeframe context in one place so you can make your own decisions without constantly changing charts. It does not predict price, it does not place trades, and it will not save a bad trade from bad risk management.
Not just for one school of trading
The engine underneath is pure price action: swings, breaks, gaps, zones, levels. Whether you call the labels by their ICT names is up to you — there is a Terminology setting with two modes:
- Universal (default): High Sweep, Low Sweep, Demand Base, Supply Base, Gap.
- ICT / SMC: BSL, SSL, OB, FVG.
Same detection, same math, different words. A trend trader reading Daily context for a 1H entry and an ICT trader hunting a 4H FVG in discount are both looking at the same underlying events. Pick the dialect you think in.
What is different about this build
None of the individual concepts here is new. Traders have marked swings, gaps, previous highs and supply/demand zones for years. The work is in making all of them share the same higher-timeframe candles and the same event state, instead of stacking several unrelated indicators and hoping their definitions line up.
The script builds up to four HTFs locally from chart bars, then feeds those closed candles to every module. Structure calculations keep running when another feature needs them, even if the BOS/MSS drawings are hidden. A confirmed gap has one identity shared by its price-axis projection and its copy in the floating candles. Dynamic alerts from different modules are collected before they are sent, so events that happen together arrive together. That integration is the main reason this is one indicator rather than a bundle of smaller ones.
Confirmed events and live elements
This part matters more than any feature, so it comes first.
Every HTF candle is built locally, bar by bar, from the chart's own data. There are no security requests anywhere in the script, so there is no higher-timeframe lookahead. While an HTF period is open, its candle updates with the market. When that period ends, its final OHLC is committed to the script's closed-candle history.
New swings, structure breaks, sweeps, gaps, base zones and equal levels are confirmed when the relevant HTF candle closes, using the closed values available at that point. A confirmed event is not moved or recalculated afterward. Its drawing can still be faded, frozen, hidden or removed later by the selected mitigation, invalidation and object-cap rules.
The live candle, countdown, provisional sweeps and optional live-candle gaps do update intrabar. A provisional mark may change or disappear before the HTF closes; that is expected, and those elements are styled as unconfirmed. As with any chart-based script, a data-feed correction, session change or a different amount of loaded history can also change what is reconstructed after a reload.
Two smaller engineering details you'd only notice if they were missing:
- If your chart's history starts partway through an HTF period, that first incomplete candle is detected and thrown away instead of being allowed to poison the swing, RSI and gap calculations.
- The floating layout manages its own drawing budget. TradingView refuses to draw objects more than 500 bars into the future; if your settings would cross that line, the layout compresses itself — gaps first, then spacing, then offset — and tells you it did. This substantially reduces the risk of hitting TradingView's draw-ahead limit.
Reading the floating candles
Each enabled timeframe appears as a group of candles floating to the right of price — closed candles drawn solid, and the still-forming candle drawn with a dashed border and a lighter body so its status is clear. Under each candle sits a time label (hour for intraday, weekday for daily, date for weekly, month for monthly, with a timezone override if you want labels in your local time). Beside each group's live candle: the timeframe tag and, if you want it, a countdown to the HTF close — "2d 13h" on a weekly candle, "42m 10s" on a 1H. One honest note on the countdown: it refreshes when the chart receives an update, not on its own clock, so on a quiet market it can sit still between ticks.
The indicator also watches your configuration for you. Pick an HTF that isn't actually higher than the chart timeframe and that group is hidden with a warning instead of showing you nonsense. Enable the same timeframe twice and it points out you're spending drawings on a duplicate. Load it on Heikin Ashi or Renko and it reminds you that every calculation is using synthetic prices — useful to know before you trust a level.
Market structure: BOS and MSS
Swings are confirmed with a symmetric pivot: a candle whose high (or low) stands above (below) a set number of neighbours on both sides — and each timeframe gets its own pivot length, because the swing that matters on a weekly is not the swing that matters on a 1H. When an HTF candle closes through the last confirmed swing:
- BOS — the break continues the current direction of delivery.
- MSS — the break goes against it. Delivery may be shifting.
Wick pokes through a swing don't count as structure here; only a closing break does. A line is drawn from the broken swing to the breaking candle with a tag like "MSS · 1D".
One design decision worth knowing: the structure engine runs whenever anything needs it — the display, the structure alerts, or the stricter base-zone validation modes described below. Turning the BOS/MSS marks off hides the drawings; it does not secretly disable the logic other modules depend on.
Premium and discount
The dealing range of your 1st HTF, split at its midpoint. Above 50% is premium; below is discount. Traders who use this framework often look for long-side context in discount and short-side context in premium. The module shows location within the range; it is not a directional signal by itself.
Two ways to build the range:
- Swing Anchored (default): from the latest confirmed swing high to the latest confirmed swing low. The range holds steady between confirmations and updates when a new pivot is confirmed.
- Rolling Lookback: highest high to lowest low over N closed candles, with an option to let the live candle expand it intrabar. Generic, mechanical, always available.
Range extremes, the dashed 50% equilibrium line, and optional shaded premium/discount halves.
Price gaps (FVG) — persistent, and strict about their history
The classic three-candle imbalance is defined by non-overlap between the first and third candles. A bullish gap forms when the third candle's low is above the first candle's high; a bearish gap is the inverse. It is confirmed only when the third candle closes.
Each confirmed gap receives its own identity and mitigation state while it remains relevant to the price-axis projection or the recent floating-candle history:
- Mitigation Rule — you decide what "used up" means: Full Fill (a wick reaches the far edge), CE Touch (a wick reaches the 50% midpoint), Chart Close Through (a chart-timeframe candle closes beyond the gap), or Originating HTF Close (the gap's own timeframe closes through it). Pick the definition that matches how you actually trade gaps.
- Consequent Encroachment — the 50% midline of every gap, drawn dotted. Some traders use CE as a more precise reaction or entry reference than the outer edges.
- Price-axis projection (default on) — each gap is drawn at its real chart location and extended right to the current bar, so you can judge lower-timeframe price action against the actual HTF zone. Mitigated gaps either fade and freeze, or disappear entirely if you enable Unmitigated Only.
- The overlay copies use the same confirmed state as the projections. If a CE Touch mitigates a tracked zone on the price axis, its copy between the floating candles receives the same verdict. When the drawing cap hides an older projection, the script retains a lightweight buffer of 16 hidden gap states per HTF. The overlay displays no more than 12 candles, so the confirmed gaps that can still appear there remain covered by that state history.
- Live-candle gap (off by default) — preview the gap forming with the current candle, clearly unconfirmed, may vanish before the close.
Each timeframe has its own bullish/bearish colour pair so four layers of gaps stay readable.
Base zones / Order blocks
The last opposing candle before a move that breaks away from it — demand below, supply above. How strict you want to be is a setting, not a debate:
- Basic: a close beyond the most recent opposing candle. Generous; produces many zones.
- Displacement (default): the breaking candle's body must also exceed the average HTF range × your multiplier. Filters the half-hearted breaks.
- Structure + Displacement: the break must additionally break confirmed market structure on that timeframe.
- Structure + Gap: strictest — displacement, a structure break, and the move must leave a same-direction imbalance behind. This is the "displacement that leaves an FVG" standard.
You also choose the zone's shape — Open to Extreme (the tighter, classic definition), Full Candle, or Body — and how far back to search for the opposing candle, because the real base is not always the immediately previous bar. Every zone gets an optional 50% mean-threshold line and extends right while it remains within its configured lifetime. Invalidation follows your selected rule: Wick, Chart Close, or Originating HTF Close. The oldest drawing can also be removed when the module reaches its object cap.
Liquidity sweeps
In liquidity-based frameworks, confirmed swing highs and lows are treated as potential pools of resting liquidity. This module marks when price trades through those levels, in two distinct ways:
- Wick raid ("Only Wicks"): the candle trades through the swing but closes back inside. The level was run and rejected in one move.
- Close-through Reclaim: a candle closes beyond the swing — a breakout — and the next close comes back through it. A failed breakout, confirmed one candle later.
Run either, or both. Each sweep draws a dotted line from the swept swing, a shaded zone across the raid, and a tag — "SSL · 4H" in ICT mode, "Low Sweep · 4H" in Universal. Two optional filters are available. The volume filter compares the sweep candle with up to 20 preceding HTF candles once at least five are available; on forex and most CFDs this is tick volume, not centralized exchange volume. The RSI filter uses Wilder smoothing on closed HTF candles only.
Sweeps are always confirmed on the HTF close — that is not a setting, it's the contract. What is a setting is Show Provisional Live Sweeps: dashed intrabar previews tagged with a question mark, for traders who want to see the raid developing and accept that it may evaporate before the candle closes.
Once a sweep is confirmed, that stored pivot is consumed and cannot fire again.
Stale liquidity retires itself
Here's a subtle problem most liquidity scripts ignore: a swing level that price has already traded through is no longer liquidity — the stops are gone — yet the old pivot data still sits in memory, quietly eligible to pair into future "equal highs" or fire late signals at a dead level.
This indicator retires those pivots explicitly according to the selected Pivot Consumption Basis. You can treat any wick through the swing as consumption, or wait for the originating HTF to close through it. Once consumed, the pivot can no longer form sweeps or equal-level pairs. There's one deliberate exception: when Close-through Reclaim detection is active, a close-broken pivot survives exactly one more HTF candle, because the reclaim it's waiting for needs it alive. If the reclaim comes, it registers as a sweep; if it doesn't, the pivot is removed.
Equal highs and equal lows
Two confirmed swings within a configurable tolerance of each other (measured as a fraction of the average HTF candle range) form an EQH or EQL. Traders commonly watch these double-top and double-bottom areas as potential liquidity pools. The level is drawn dotted from the first pivot, extends right, and is removed when your selected liquidity-taken condition is met: wick, chart close, or the originating HTF's close. Both source pivots are consumed along with it.
Previous highs and lows
The previous closed candle's high and low for every enabled timeframe, drawn as labelled lines extended to the current bar. Enable Daily and Weekly groups and you get PDH/PDL and PWH/PWL automatically. They are widely watched reference levels, and this is the simplest module in the script.
Alerts that behave
Eight standard conditions are available in TradingView's alert dialog, named for both dialects:
- Bullish Low Sweep / SSL Taken — and its bearish mirror.
- Bullish HTF Price Gap / FVG Formed — and bearish.
- Bullish Structure Break (BOS/MSS) — and bearish.
- Bullish Base Zone / Order Block — and bearish.
On top of those, each module has a dynamic alert toggle that sends the symbol, timeframe and event, plus the price where that event has a single reference level, through one alert created with "Any alert() function call". Everything confirmed on the same chart bar is bundled into one combined message. If the Daily and the 4H both sweep at the same moment, one notification carries both events. Dynamic alert events are generated from confirmed HTF closes only.
One TradingView quirk to remember: an alert keeps a snapshot of the settings it was created with. Change the indicator's inputs, recreate the alert.
A workflow, in either dialect
The universal read:
- Let the highest timeframe's structure marks give you the directional bias.
- Check where price sits in the dealing range — early in the move or late.
- Note the untaken levels above and below: previous highs/lows, equal highs/lows. Treat them as potential liquidity objectives or reference levels, not promises about where price must go.
- Wait for a level to actually be taken — the sweep tag — rather than acting the moment price touches it.
- Frame the entry at a fresh zone or unmitigated gap that lines up with the bias.
The ICT read uses the same skeleton with its own vocabulary: establish the HTF narrative and possible draw on liquidity, locate premium versus discount, then watch how price behaves after a raid — SSL into discount for a possible long setup, or BSL into premium for a possible short. From there, traders can apply their own execution rules around the PD array left by displacement, with CE available as a finer reference. The countdown shows how long the current HTF candle has left before any live idea can be confirmed.
Neither routine is a mechanical system or an order-flow feed. They are discretionary, OHLC-based ways to organise price action, and they assume you bring your own execution rules, session timing and risk limits.
Settings, group by group
There are twelve numbered groups. They are arranged in roughly the same order in which I would teach someone to build a chart: first decide what data and timeframes you are looking at, then add structure and location, then add zones and liquidity, and only after that configure alerts and lifecycle rules.
Before going through them one by one, keep three scales separate in your mind:
- The chart timeframe is the timeframe printed at the top of TradingView — for example, 15 minutes. Inputs whose names end in “Bars” use these chart bars. On a 15-minute chart, 300 bars represents 75 chart-hours of bars. It does not mean 300 one-hour candles simply because the 1st HTF is 1H.
- The selected HTFs are the candles built by the indicator — for example, 1H, 4H and 1D. Swing confirmation, FVG formation, structure breaks, sweep confirmation and base-zone formation are evaluated from those HTF candles.
- The instrument, feed and chart session determine the raw bars available to the script. ES futures with regular trading hours selected can aggregate differently from the same symbol with extended hours. A stock chart with pre-market enabled can also produce different locally aggregated HTF candles from a regular-session-only chart.
It also helps to know which kind of input you are touching. A colour, horizontal offset or label option changes presentation only. A pivot length, mitigation rule or validation mode changes what can qualify or when its state changes. A maximum-object input controls how much history remains visible; it does not make the newest signal stronger or weaker.
0 · General
Terminology
This switches the words printed on the chart. Universal mode uses neutral labels such as High Sweep, Low Sweep, Demand Base, Supply Base and Gap. ICT / SMC mode uses BSL, SSL, OB and FVG. The underlying prices, conditions and event timing are identical in both modes. Changing the terminology will not discover a new setup or remove an existing one; it only changes the language used to describe it.
Warn on Synthetic Chart Prices
The script always reads the OHLC values of the active chart. On a normal candlestick chart those are the instrument's standard prices. On Heikin Ashi, Renko and other synthetic chart types, the OHLC values are transformed values. Leave this warning enabled unless you deliberately want zones and structure calculated from synthetic prices. Disabling the warning only hides the notice; it does not convert synthetic prices back into standard prices.
1 · HTF Candles
1st HTF Timeframe
This is the main higher timeframe and the anchor for several other modules. It must be higher than the chart timeframe. On an ES 15-minute chart, 1H is a sensible first layer: every 1H candle is assembled from four 15-minute chart bars, subject to the active session and the data available on the chart.
If you select a timeframe that is equal to or lower than the chart timeframe, the lane is hidden and a warning is shown. That safeguard matters because a “higher-timeframe” candle reconstructed from a lower or equal timeframe would give a misleading hierarchy.
Candles per HTF
This controls how many candles are drawn in each floating group, including the live candle. It is a display-history setting, not the amount of history used by the calculation engine. A value of 4 gives a compact view of the last three closed HTF candles plus the current one. Increasing it gives more visual context, but every additional candle needs more boxes, lines and labels and also takes more horizontal space.
Horizontal Offset
This is the distance, measured in chart bars, from the last price bar to the first floating HTF group. It does not shift the source data in time and has no effect on detection. Increase it if current-price drawings or labels collide with the first group. Reduce it if the chart has too much empty space. If the full layout would cross TradingView's forward-drawing limit, the script compresses the layout automatically.
Candle Spacing
This is the space between candles within each floating group. The minimum value of 3 lets adjacent bodies touch cleanly. Larger values make individual candles easier to distinguish but widen every group. It changes only the drawing layout.
Bullish / Bearish colours and Wicks / Border colours
These four swatches style the floating candles. They do not style the chart's own candles and do not change bullish/bearish classification. Choose colours with enough contrast against your chart background; thin borders and wicks become difficult to read when their colour is too close to the background.
Highlight Live Candle
When enabled, the still-forming HTF candle receives a dashed border and lighter body. This is worth keeping on because a live HTF high, low and close can still change. Turning it off does not make the live candle confirmed; it only removes the visual distinction.
Show TF Tag
Shows labels such as 1H, 4H and 1D beside the corresponding live candles. The adjacent colour controls the tag colour. This is especially useful when three or four lanes are visible; without it, similar-looking groups are easy to confuse.
Show Time Labels
Shows the period identifier below each floating candle. Intraday candles use time, daily candles use weekday, weekly candles use date and monthly candles use month. These labels explain which actual period each floating candle represents.
Time Label Offset
Moves the time labels vertically below the candles. The distance is scaled from the average range of that HTF, so the same value can look different on ES, EURUSD and BTCUSD. Raise it when labels overlap long lower wicks; lower it when labels sit unnecessarily far away. It is a presentation setting only.
Show Candle Countdown
Displays the remaining time before the active HTF candle closes. The countdown is useful for separating a developing idea from a confirmed event. It refreshes when TradingView sends the chart a new update, so it may appear stationary between ticks in a quiet market.
Time Zone
Leave this blank to use the exchange timezone. You may enter UTC, GMT offsets or an IANA timezone such as Asia/Kuala_Lumpur. This option changes the text under the floating candles; it does not change exchange sessions, HTF boundaries or the candles used by the engine. If your goal is to change which bars belong to a session, change the chart's session settings, not this field.
2 · Multi-Timeframe
The 2nd, 3rd and 4th rows each contain three controls: an enable switch, a timeframe and a Gap. The gap here means horizontal separation between floating groups. It is not a price gap and has nothing to do with FVG detection.
Use ascending timeframes whenever possible. On a 15-minute execution chart, 1H / 4H / 1D is a clean three-layer hierarchy. A weekly fourth lane can be useful for analysis, but its much larger range may compress the price scale and dominate a publication image. If two enabled rows use the same timeframe, the script warns you because the duplicate consumes drawing capacity without adding information.
Disabling a row removes that floating lane and prevents lane-specific modules from producing output for it. The timeframe and gap values remain in the settings so you can enable the row again later.
3 · Market Structure (HTF)
1st / 2nd / 3rd / 4th
These switches decide which enabled HTF lanes draw BOS and MSS marks. A mark is confirmed only after the relevant HTF closes through a confirmed swing. Enabling more lanes gives a fuller hierarchy but can create overlapping labels when several timeframes break structure near the same price.
The switches govern the drawings, not every internal use of structure. The structure engine can continue running when a structure alert or a structure-dependent base-zone validation mode needs it. This prevents the rest of the indicator from silently changing just because you hid the BOS/MSS marks.
Bullish / Bearish colours
These style the structure lines and tags only.
Max Structure Marks
This is the maximum number of structure drawings retained across all enabled HTFs. When the limit is exceeded, the oldest mark is removed first. Lower values keep the current chart clean; higher values preserve more historical context. The cap does not alter the latest swing state or whether a new break qualifies.
4 · Premium / Discount · 1st HTF
This module belongs to the 1st HTF only. It places current price inside a dealing range and marks its 50% equilibrium. It is context, not a buy/sell instruction.
Show Equilibrium (50%)
Turns the range, midpoint and optional shaded halves on or off. Above the midpoint is premium and below it is discount. A trader still needs a directional idea and an execution rule; being in discount alone is not evidence that price must rise.
Range Source
Swing Anchored uses the latest confirmed 1st-HTF swing high and swing low. It remains stable between pivot confirmations and suits a discretionary structure-based reading.
Rolling Lookback uses the highest high and lowest low over the selected number of closed 1st-HTF candles. It is always mechanical and updates as the window rolls. This can be more convenient when a confirmed swing pair is not yet available, but the range may change simply because an old extreme leaves the window.
Dealing Range Lookback
This affects Rolling Lookback only. A small value makes the range react quickly to recent price action; a large value produces a broader and slower-moving range. It is not used by Swing Anchored mode.
Include Live Candle in Rolling Range
When enabled, the still-forming 1st-HTF candle may expand the rolling high or low intrabar. The shaded range can therefore move before the HTF closes. Leave it off when you want a range made entirely from closed candles. Swing Anchored ignores this setting.
Shade Zones and Premium / Discount colours
The switch controls the background halves; the two swatches control their colours. The equilibrium line can remain useful even if you turn the shading off to reduce clutter.
5 · Price Gaps / FVG
1st / 2nd / 3rd / 4th
These select the enabled HTFs on which three-candle gaps are detected. More timeframes produce more zones, not necessarily better zones. If you execute on 15 minutes, starting with 1H gaps only is a practical way to learn how the module behaves before adding 4H or Daily layers.
Show Gaps in HTF Overlay
Draws gap markers between the floating candles. This is a visual copy of the confirmed gap state. Turning it off leaves the persistent price-axis zones available if their separate switch remains on.
Unmitigated Only
When enabled, a gap disappears after it satisfies the selected mitigation rule. When disabled, a mitigated gap freezes and fades so you can review its history. This changes post-mitigation visibility, not the original formation rule. Use it for a clean active-level chart; turn it off when studying how old gaps behaved.
Consequent Encroachment (CE)
Draws the 50% line inside each gap. It is a finer reference within the zone, not a separate gap and not an entry signal on its own.
Persistent Gaps on Price Axis
Projects confirmed gaps at their real historical price location and extends them toward the current bar. This is the view used to compare lower-timeframe price with an HTF imbalance. It is independent of how many floating candles are displayed.
Include Live-Candle FVG
Evaluates a possible gap involving the current, still-forming HTF candle. It may appear, shrink or vanish before the HTF close. Keep it off if you want confirmed events only; enable it only when you deliberately want an intrabar preview.
Mitigation Rule
- Full Fill (Wick) waits for price to reach the far boundary of the gap.
- CE Touch (Wick) treats a touch of the 50% midpoint as mitigation and therefore retires zones sooner.
- Chart Close Through waits for a close from the active chart timeframe through the far boundary. Changing the chart from 15 minutes to 5 minutes changes the closing observations available to this rule.
- Originating HTF Close waits for the timeframe that created the gap to close through it. This is usually the slowest and most conservative lifecycle rule.
Max Gap Extension Bars
This is a lifetime measured in chart bars. On a 15-minute chart, 300 bars is 75 chart-hours of bars; market closures and session gaps mean it is not necessarily 75 continuous clock-hours. When the lifetime ends, the zone stops extending. It does not mean 300 HTF candles.
Max Rendered Gaps
This is the global number of price-axis gap drawings visible across all selected HTFs. Once the cap is exceeded, the oldest drawing is hidden first. Its lightweight mitigation state is retained so the floating overlay does not forget whether that older gap was filled. Raise the cap for research; lower it for a cleaner chart and a lighter drawing load.
FVG Border Width and per-HTF colour pairs
Border Width styles the gap boxes inside the floating overlay. Each timeframe has its own bullish and bearish colour pair so overlapping layers can be distinguished. Colour and transparency change presentation only.
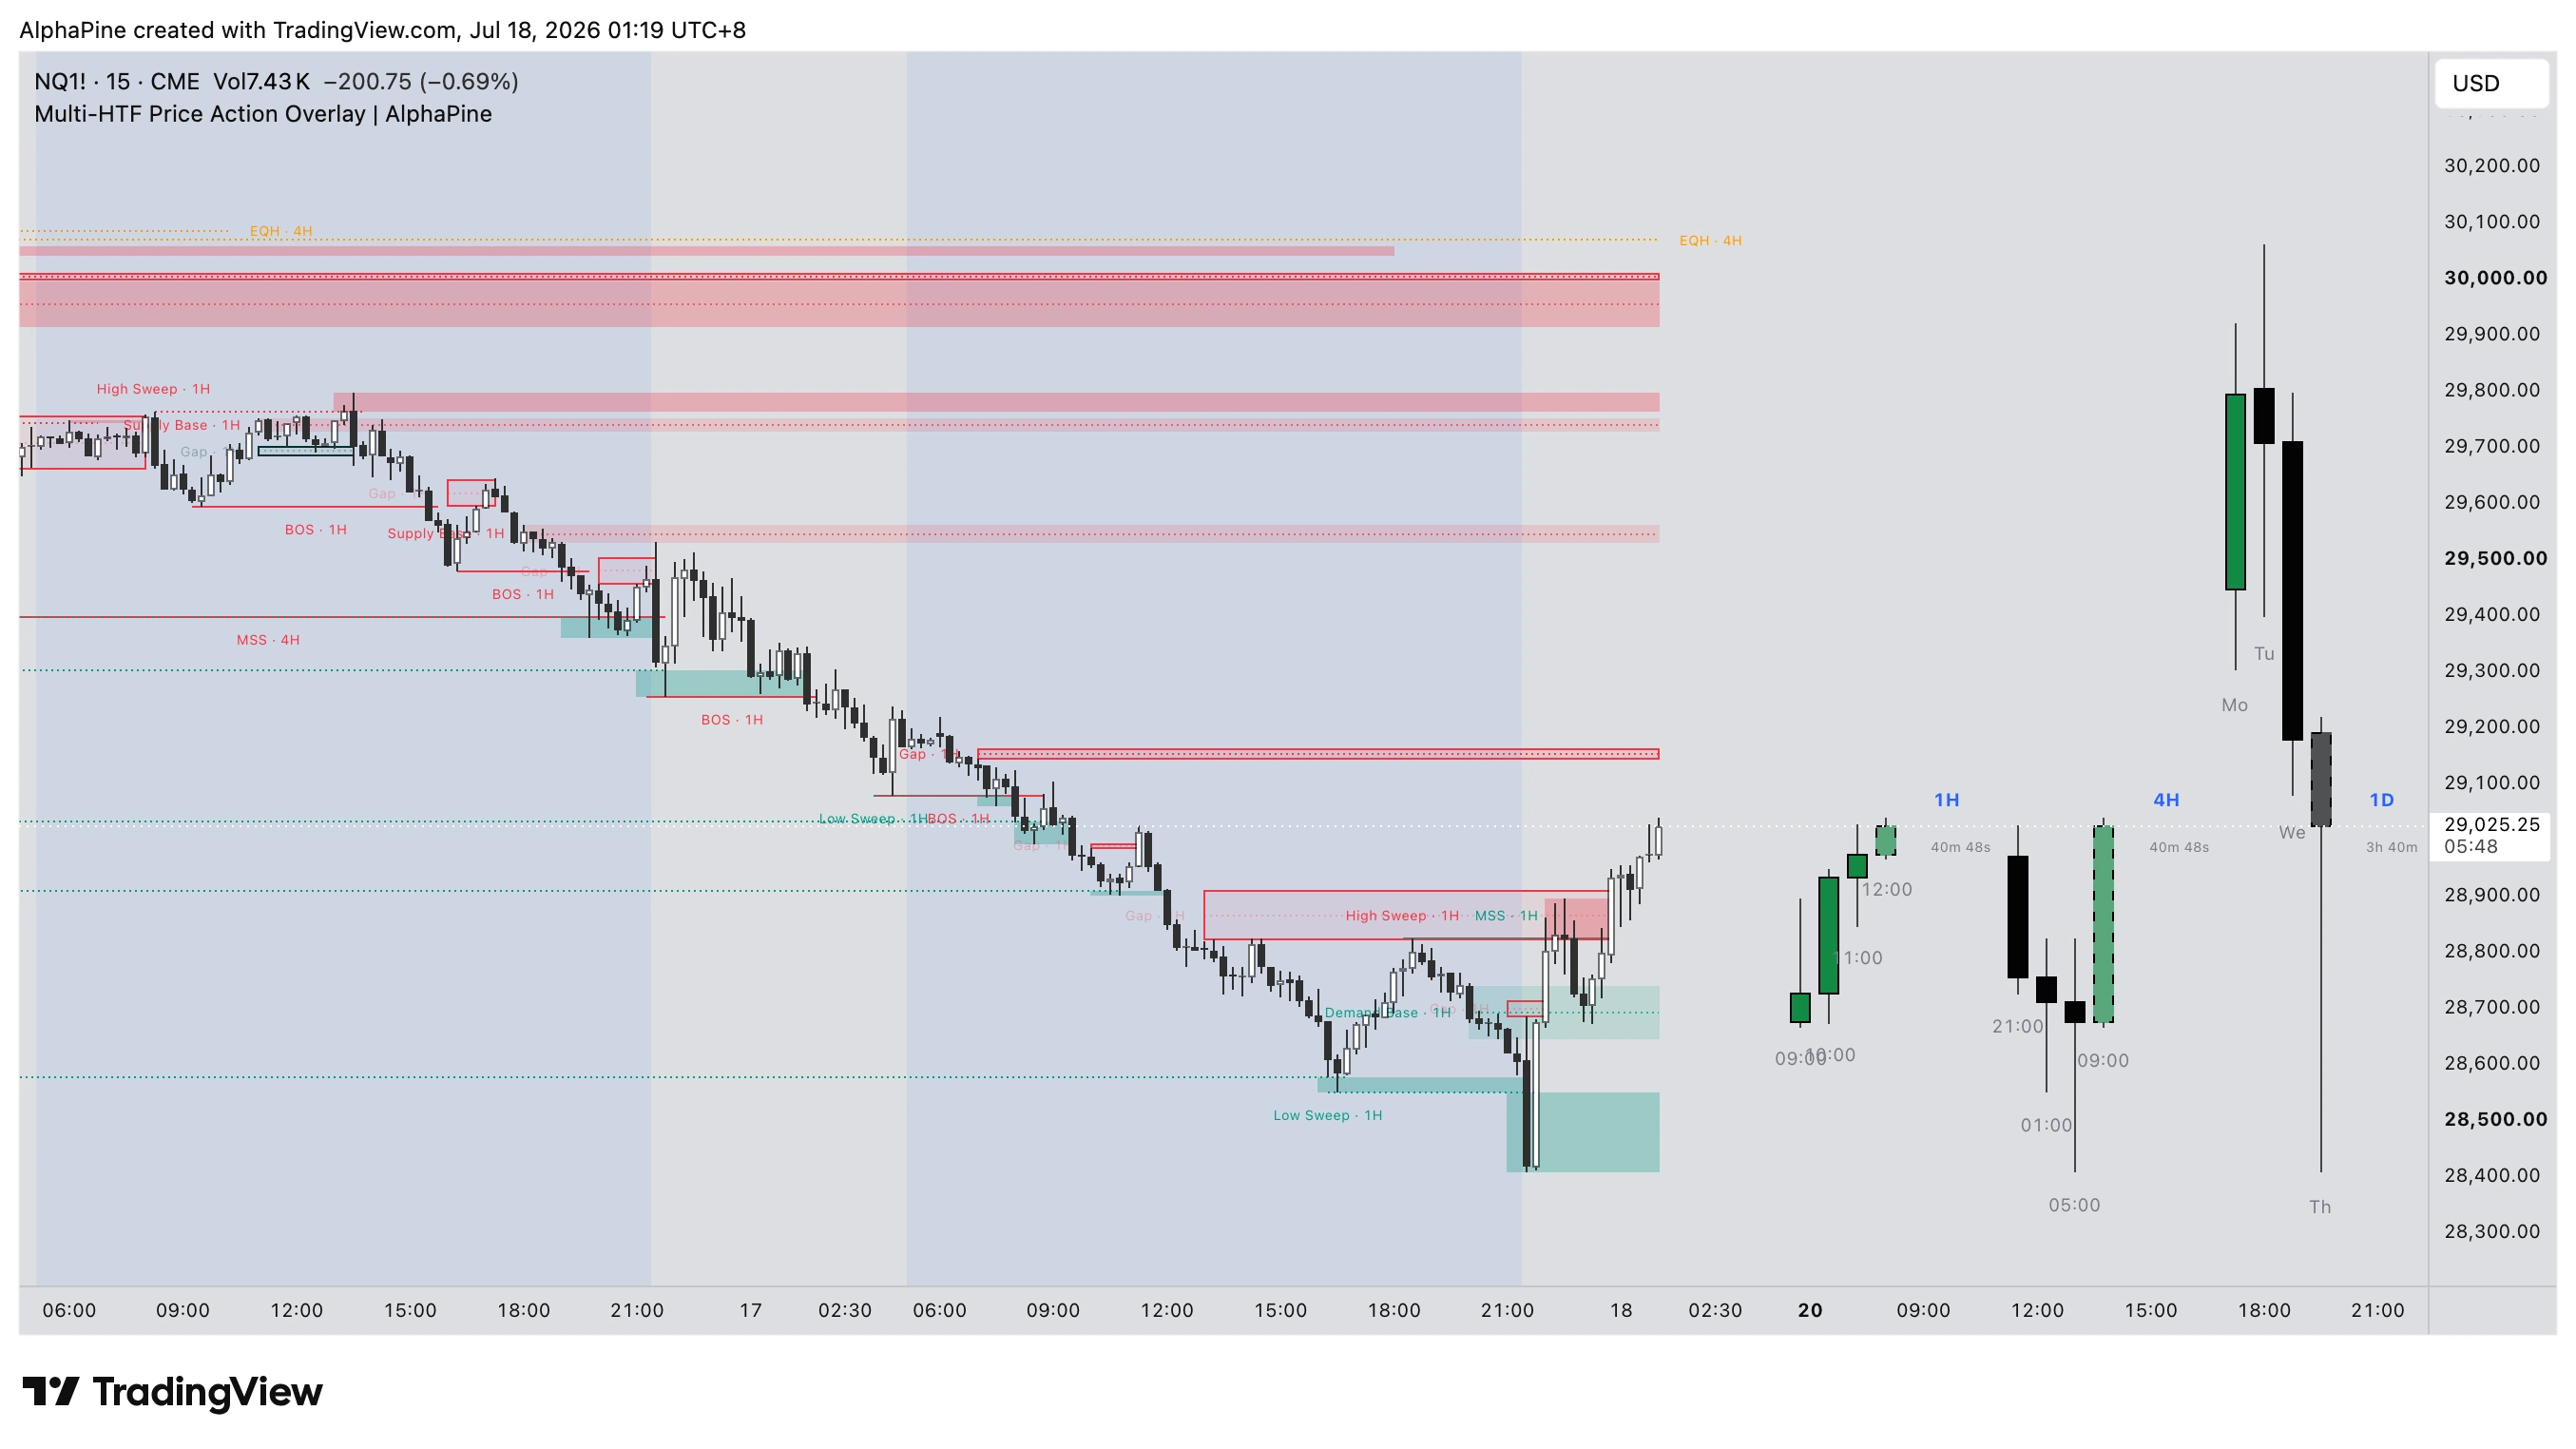
NQ1!, 15-minute chart. The red price-axis projections show confirmed higher-timeframe gaps at their actual prices, while the floating 1H / 4H / 1D candles preserve the higher-timeframe context beside current price. The same chart also contains labelled structure, sweep and base-zone events; these will be discussed again in the relevant sections below.
6 · Base Zones / Order Blocks
1st / 2nd / 3rd / 4th
These choose which enabled HTFs can form demand/supply bases, called order blocks in ICT / SMC mode. As with FVGs, adding every timeframe can make the chart harder to read. Start with the timeframe that defines your setup.
Validation Mode
- Basic accepts a break beyond the most recent opposing candle. It is intentionally permissive and produces the most zones.
- Displacement adds a body-size requirement. This filters weak breaks and is a balanced default.
- Structure + Displacement also requires a confirmed swing break on the same timeframe. It produces fewer, more selective zones.
- Structure + Gap additionally requires a same-direction three-candle gap. It is the strictest option and may produce very few zones on quiet instruments or high timeframes.
Zone Basis
Open to Extreme uses open-to-low for demand and high-to-open for supply, giving a tighter classic zone. Full Candle includes the complete high-low range and is the widest. Body uses only open-to-close. A wider basis is touched and invalidated differently from a tight basis because its boundaries are genuinely different.
Opposing Candle Search
Sets how many closed HTF candles the engine may search backward for the most recent opposing candle before displacement. A value of 1 insists on the immediately preceding opposing candle. A larger value can locate an earlier base, but also associates the move with a more distant candle. Use enough depth to capture the setup definition you follow, not simply the value that creates the most zones.
Displacement Filter ×
The displacement candle's body must exceed the average prior HTF candle range multiplied by this value. Lower values admit more and weaker moves. Higher values demand stronger expansion and produce fewer zones. Because the threshold is normalized by each instrument's own HTF range, 0.8 is portable across markets, but it will not produce the same number of zones on every instrument.
Bullish / Bearish colours, OB Zone Opacity and Mean Threshold
The colours style demand and supply zones. Opacity uses TradingView's transparency convention: 0 is fully opaque and 100 is invisible. Mean Threshold draws the 50% reference inside each zone. These controls do not change validation.
Max Order Blocks
This is the total number retained across all enabled HTFs. Oldest zones are removed first when the cap is exceeded. It controls drawing history, not the quality threshold.
Max Base-Zone Extension Bars
This is the maximum extension lifetime in chart bars. A zone may stop earlier if the global Sweep / Base Invalidation rule invalidates it.
7 · Liquidity Sweeps (HTF)
1st / 2nd / 3rd / 4th
These choose the enabled HTFs on which sweeps are evaluated. A 1H sweep on an ES 15-minute chart is confirmed when the relevant 1H candle closes, not the moment a 15-minute wick first crosses the level.
Pivot Length · 1st / 2nd / 3rd / 4th
Each value is the number of HTF candles required on both the left and right of a pivot. A length of 2 means the candidate swing needs two neighbouring candles on each side, so confirmation necessarily arrives two HTF candles after the swing itself. Larger values find fewer, broader swings and increase confirmation delay. These same pivots feed structure, sweeps and equal levels for that timeframe.
Detection Type
Only Wicks requires price to trade through a pivot and close back inside during the same HTF candle. Only Close-through Reclaim allows a close beyond the pivot, then requires the next HTF close to reclaim it. Wicks + Close-through Reclaim recognises both patterns. They are different events; the second one confirms one HTF candle later by definition.
Show Provisional Live Sweeps
Displays dashed previews while the HTF candle is open. They may disappear if price no longer meets the condition at the close. This option never turns an intrabar preview into a confirmed alert.
Enable Volume Filter ×
When enabled, the sweep candle's HTF volume must exceed the preceding HTF average multiplied by the selected factor. At 1.5, volume must be 50% above average. The filter is skipped until enough closed HTF candles are available. Exchange-traded futures and stocks normally provide exchange volume; most forex and CFD feeds provide tick volume, so the same multiplier does not carry the same meaning across those markets.
Enable RSI Filter · Length, OB and OS
This requires bearish sweeps to occur with HTF RSI at or above the overbought threshold, and bullish sweeps with RSI at or below the oversold threshold. RSI is calculated from closed HTF candles. Length controls smoothing; OB and OS control the thresholds. This filter gates sweep confirmation only — it does not add an RSI panel to the chart.
Bullish (SSL) / Bearish (BSL) colours and Sweep Zone Opacity
These style the sweep line, zone and tag. Universal terminology changes the label text, not these bullish/bearish directions. Opacity 0 is solid; 100 is invisible.
Extend Sweep Zone
Keeps the zone moving to the right while it remains valid and within its lifetime. Turning it off leaves the confirmed event marked without a continuously extended box.
Max Sweep-Zone Extension Bars
The extension lifetime is measured in chart bars. The zone can end sooner if its extreme is invalidated under the global rule in group 11.
Max Sweeps on Chart
This is the global drawing cap across selected HTFs. Each sweep uses a line, a box and a tag, so high values consume TradingView objects quickly. Oldest sweeps are removed first.
The NQ example shown in the FVG section also demonstrates why these modules are more useful when read together. It contains a confirmed 1H High Sweep near the left side of the chart, a 4H MSS followed by several 1H BOS marks during the decline, supply bases above price, a demand base below price, and later 1H Low Sweep and High Sweep events around the reversal area. One image is used for both explanations so the relationship between the events is not lost by switching to a different market sample.
8 · Equal Highs / Lows
Show EQH / EQL and colour
The checkbox turns equal-level detection and drawings on or off; the swatch styles the lines and tags. The feature applies to every enabled HTF group and uses that group's confirmed pivots.
Tolerance × Avg Range
This is the maximum distance between two pivots, expressed as a fraction of average HTF candle range. At 0.10, two highs may differ by up to 10% of that timeframe's average range. A larger tolerance finds more approximate matches but can label levels that do not look genuinely equal. A smaller tolerance is stricter and may find very few matches on volatile instruments.
Max EQ Levels
This is the total number of EQH/EQL drawings retained. It changes visible history, not tolerance.
Liquidity-Taken Rule
Wick removes the level as soon as price trades through it. Chart Close waits for the active chart bar to close through. Originating HTF Close waits for the level's own timeframe to close through. The choice controls when the liquidity pool is considered consumed.
Max EQ Extension Bars
The level can extend for this many chart bars unless it is taken sooner.
9 · Liquidity Levels
Show Previous HTF High/Low and colour
Shows the high and low of the previous closed candle for every enabled HTF lane. With 1H, 4H and 1D enabled, all three pairs can be present. This is a display module; it does not make FVGs, sweeps or structure more likely to qualify. Multiple levels can sit very close together, so it is reasonable to turn them off for a hero image and enable them on a chart dedicated to liquidity references.
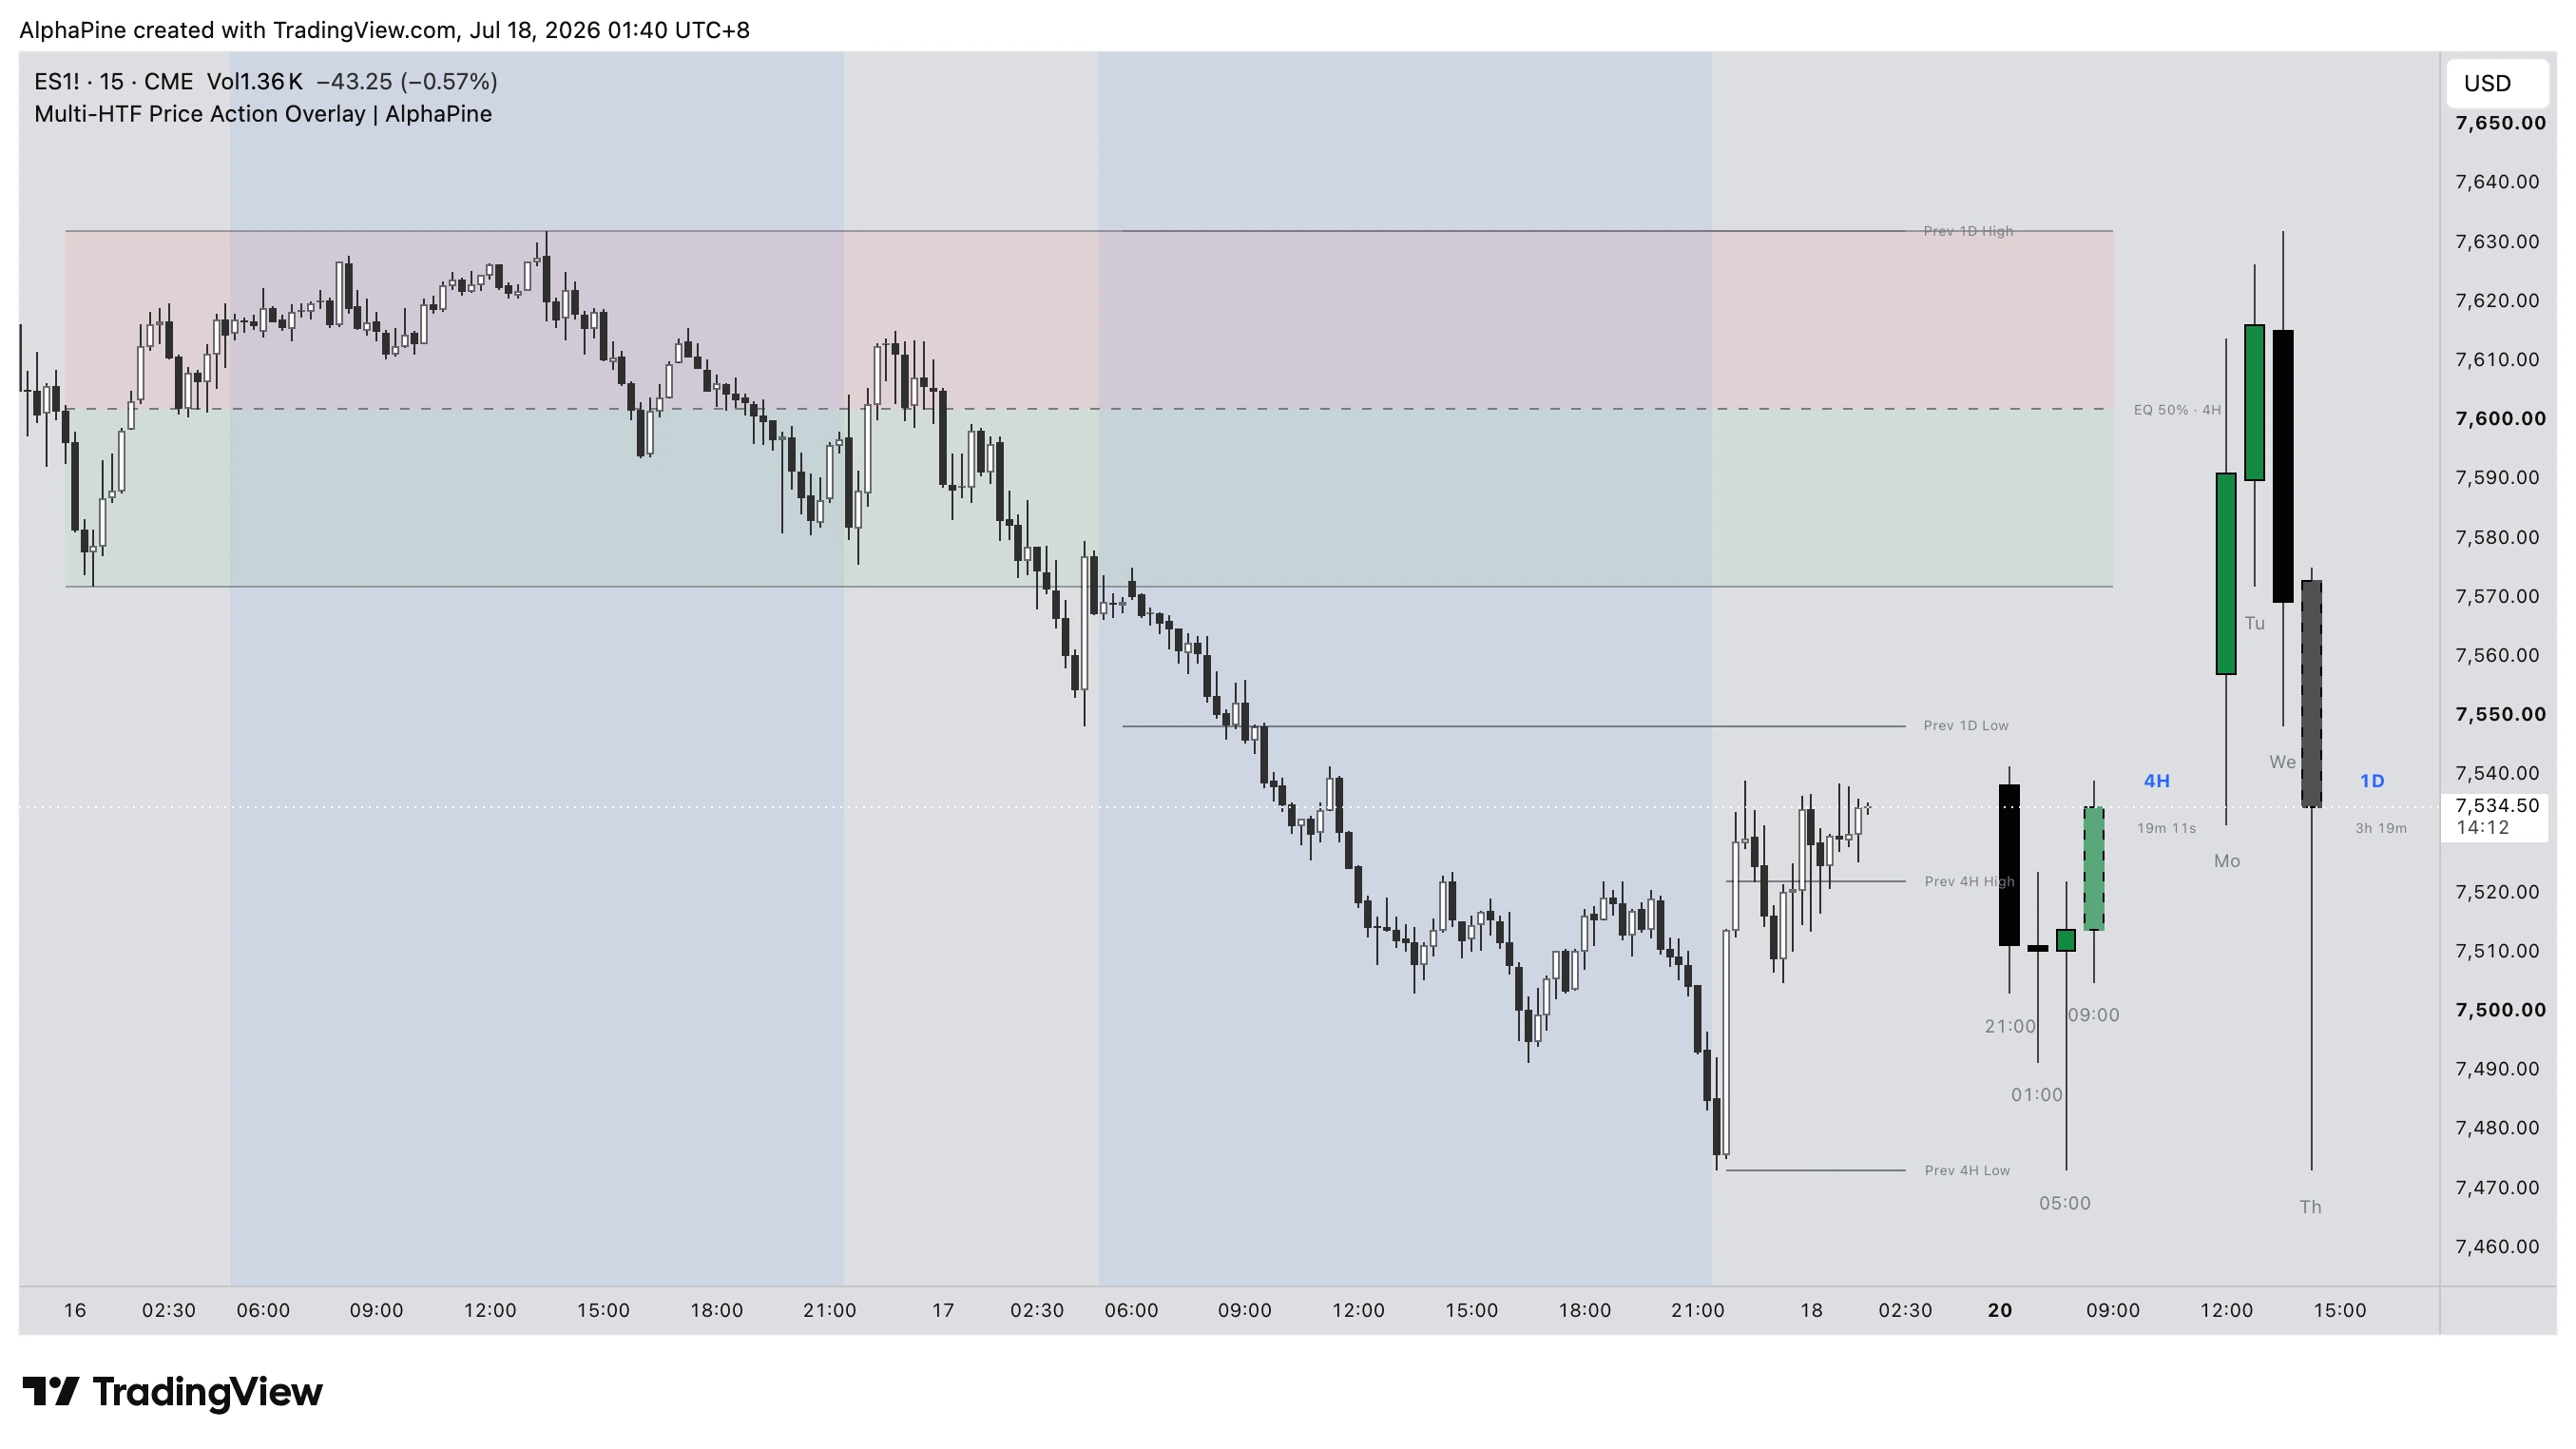
ES1!, 15-minute chart with the 4H dealing range enabled. The dashed midpoint is the 4H equilibrium; the upper half is premium and the lower half is discount. Previous 4H and Daily highs/lows remain separate references, showing that a previous-candle level and a dealing-range boundary are not the same calculation even when they happen to sit close together.
10 · Alerts
The four switches enable dynamic messages for confirmed sweeps, new FVGs, new order blocks and BOS/MSS events. To receive these messages, create the TradingView alert using Any alert() function call. The symbol, timeframe and event are included, and events confirmed on the same chart bar are bundled into one message.
The alert dialog also exposes the eight directional alert conditions described earlier. A disabled detection module cannot emit its event. Structure is the exception worth remembering: its internal engine can still run for a structure alert or a structure-dependent OB mode even when structure drawings are hidden.
TradingView stores a snapshot of the script and its inputs when an alert is created. If you later change timeframes, filters or rules, delete and recreate the alert. Leave all alert switches off when preparing a publication screenshot; alerts add no useful visual information to the image.
11 · Invalidation & Performance
Sweep / Base Invalidation
This global rule controls when sweep zones and base zones stop being valid. Wick reacts immediately to a trade through the relevant boundary. Chart Close waits for the active chart timeframe to close through it. Originating HTF Close waits for the timeframe that created the zone. The rule changes zone lifecycle; it does not change whether the original sweep or base was confirmed.
Pivot Consumption Basis
This decides when an old swing is retired so it cannot later create a stale sweep or EQH/EQL pair. Wick consumes it on any trade through. Originating HTF Close waits for an HTF close through it. Close-through Reclaim mode keeps a close-broken pivot alive for one extra HTF candle so a valid reclaim still has time to confirm.
Show Object-Budget Status
Displays current line, box and label usage against TradingView's limits. It is a diagnostic readout only. Turn it on if drawings seem to disappear or you are running many lanes and large caps; leave it off for normal use and publication images.
A clean publication preset for CME_MINI:ES1! on 15 minutes
The separate v2.4_setting file supplied with this publication work uses the following defaults. The purpose is not to claim that these are universally optimal trading settings. They are chosen to demonstrate the indicator clearly without allowing one module or the weekly range to dominate the image.
- Chart: standard candles, CME_MINI:ES1!, 15 minutes, with the intended session visibly stated on the chart.
- Terminology: Universal. Synthetic-price warning on.
- Floating HTFs: 1H / 4H / 1D enabled; 1W disabled. Four candles per group, horizontal offset 15, spacing 3, group gaps 4. TF tags, time labels and countdown on; time-label offset 1.5; timezone blank so exchange time is used.
- Structure: 1H and 4H on; Daily off; maximum 8 marks.
- Premium / Discount: off for the hero image.
- FVG: 1H only; overlay, CE and price-axis projection on; Unmitigated Only on; live-candle gaps off; Full Fill (Wick); 300 extension bars; 12 rendered gaps.
- Base zones: 1H only; Displacement; Open to Extreme; opposing-candle search 4; displacement multiplier 0.8; mean threshold on; maximum 6 zones; 300 extension bars.
- Sweeps: 1H only; pivot length 2; Only Wicks; provisional, volume and RSI filters off; extend zones on; 200 extension bars; maximum 12 sweeps.
- Equal levels: on; tolerance 0.10; Wick taken rule; maximum 6; 300 extension bars.
- Previous HTF High/Low: off for the hero image.
- Alerts: all off. Sweep / Base Invalidation: Chart Close. Pivot Consumption: Wick. Object-budget status: off.
The chart attached directly to the TradingView publication serves as the hero example, so it is not duplicated as an inline image in this description.
How I would adapt the starting point by instrument
- Index futures such as ES or NQ: 15m with 1H / 4H / 1D is a useful teaching hierarchy. Exchange volume makes the volume filter meaningful, but the chosen regular or extended session still affects locally aggregated candles.
- Stocks: decide first whether pre-market and after-hours belong in your analysis. Changing the chart session changes the bars from which intraday HTFs are built. Daily and higher boundaries also follow the exchange calendar.
- Forex and many CFDs: volume is usually tick volume rather than centralized traded volume. Begin with the volume filter off, then test it against the specific broker feed before trusting it. The timezone field changes labels only; it does not create a London or New York session filter.
- Crypto: the market trades continuously, but daily and weekly boundaries still follow the symbol's exchange data and timezone. On a very low chart timeframe, a 300-bar extension covers much less clock time than it does on a 15-minute chart, so lifecycle values may need to be increased.
The best way to tune the indicator is to change one class of input at a time. First settle the chart session and HTF hierarchy. Next choose detection definitions such as pivot length, mitigation and validation. Only then adjust object caps, extensions and colours. If all three are changed at once, it becomes difficult to know whether a different output came from the market logic, the lifecycle rule or simple display cleanup.
Data integrity and limitations
- HTF candles are aggregated from the chart's own bars, so they reflect your chart's session and data feed. The chart needs enough loaded history to build the candles you ask for; the first partial HTF period in the dataset is discarded rather than displayed.
- New structure breaks, sweeps, gaps, base zones and equal levels are confirmed on the relevant HTF candle close and are not moved or recalculated afterward. Their drawings can later change state or be removed under the selected lifecycle and cap rules. The live candle, countdown, provisional sweeps and live-candle gaps update in real time by design and are visually marked as unconfirmed.
- Swing-based logic confirms pivots with a delay equal to the pivot length, as any pivot method must. Levels appear when confirmed, not when first touched.
- Drawing capacity is managed with per-module caps; when a cap is reached the oldest objects are removed (or, for gaps, hidden while their mitigation history is retained). Per-timeframe priority eviction is on the roadmap.
- The countdown refreshes with chart updates, not on an independent clock.
- On forex and many CFDs, volume is tick volume, not centralized exchange volume — weigh the volume filter accordingly on those instruments.
- On Heikin Ashi, Renko and other synthetic chart types, all calculations use the synthetic OHLC — the indicator warns you about this on the chart.
- No security requests, no lookahead, and no external data are used anywhere in the script.
- This indicator is an educational and analytical tool. It is not financial advice, it does not guarantee outcomes, and past behaviour of any level, zone or signal does not assure future results. Trade your own plan, size your own risk.