

Pulse Cloud is a clean momentum map for traders who want to see direction, strength, stretch, and exhaustion without covering the chart in signals.
It converts price into a 0-10 pulse that revolves around a 5.0 equilibrium. The cloud shows which side of equilibrium momentum occupies, how far it has stretched, and whether that stretch is strengthening or fading. Optional arrows, zones, divergence labels, a compact table, standard alerts, and webhook JSON complete the workflow.
Is momentum above or below balance? How strong is the current push compared with recent history? Is it stretched, fading, or diverging from price?
Pulse Cloud is an analytical oscillator. It does not predict price with certainty, place orders, or replace risk management.
What distinguishes this implementation
Pulse Cloud brings directional state, normalized strength, stretch zones, pivot-confirmed divergence, a compact dashboard, standard alerts, and webhook event handling into one coherent workflow. These analytical concepts are not presented as newly invented. The invite-only implementation protects the specific calculation refinements, integration, visual design, and workflow behind this version without exposing its source logic.
The pulse, midline, and cloud
The pulse is an RSI-like momentum reading scaled around a 5.0 midline.
- Above 5.0: bullish momentum pressure.
- Below 5.0: bearish momentum pressure.
- Near 5.0: balance or transition. Momentum is not clearly committed to either side.
The cloud fills the distance between the pulse and its midline.
- Bullish cloud: the pulse is above equilibrium. A wider extension means stronger raw upside momentum.
- Bearish cloud: the pulse is below equilibrium. A wider extension means stronger raw downside momentum.
- Fading cloud near the midline: the current momentum leg is losing distance from balance. This is not automatically a reversal, but it is a reason to reassess continuation.
Two cloud styles are available. Smooth Layered uses stable layered opacity for a clean continuous cloud. Strength Gradient varies cloud brightness with the current normalized strength reading.
Strength is not the same as direction
Direction comes from the side of 5.0. Strength measures how far the pulse is stretched from 5.0 compared with its strongest stretch across the selected lookback. This produces a 0-100% strength score.
A bullish bias with a rising strength score means upside momentum is extending. A bullish bias with falling strength means the pulse remains above equilibrium but is losing force. The same logic applies on the bearish side.
This distinction is useful because a market can remain directionally bullish while momentum is weakening, or remain bearish while the pulse starts lifting toward balance.
Zones and extension boxes
The Overbought and Oversold levels define stretched momentum zones on the 0-10 pulse scale.
- Overbought means the pulse is above the upper stretch level.
- Oversold means the pulse is below the lower stretch level.
- Neutral means the pulse is between the two levels.
The zone boxes extend while the pulse remains stretched and lock when that condition ends. They help show the duration and extreme of a momentum extension. A stretched zone can persist in a strong trend, so Overbought is not an automatic sell signal and Oversold is not an automatic buy signal.
Arrows and divergence
Arrows mark midline crosses:
- Up arrow: the pulse crossed above 5.0.
- Down arrow: the pulse crossed below 5.0.
You can choose whether arrows follow the pulse line displayed on the chart or the raw pulse timing. The first option keeps visual line and signals synchronized; the second preserves raw timing when smoothing is enabled.
Regular divergence is optional:
- Bullish divergence: price makes a lower low while the pulse makes a higher low.
- Bearish divergence: price makes a higher high while the pulse makes a lower high.
Divergences are confirmed only after the right-hand pivot completes. For structural context, a confirmed label is displayed on the earlier pivot bar, but the divergence was not known at that earlier time; it becomes available only on the later confirmation bar. A developing label may change while the confirmation bar remains open and becomes final after that bar closes. Treat divergence as a context warning or possible change in momentum quality, not as a standalone entry order.
Reading the table
The optional table is a compact summary of the current oscillator state:
- Bias: Bullish, Bearish, or Neutral from the side of the 5.0 midline.
- Strength: normalized 0-100% stretch from equilibrium, with a segmented visual bar.
- Momentum: rising, falling, or flat pulse slope over the selected momentum length.
- Duration: bars since the last midline cross. A larger count means the current leg is more mature.
- Zone: Overbought, Oversold, or Neutral based on the selected levels.
Read the fields together. For example, Bearish bias plus Rising momentum does not mean the indicator has turned bullish. It means the pulse is still below equilibrium but recovering toward it.
A practical reading routine
- Start with Bias. It tells you which side of equilibrium owns the current momentum state.
- Check Strength and Momentum. Is the move expanding, holding, or fading?
- Check Zone. A deeply stretched move may still continue, but late entries carry different risk from early trend participation.
- Use arrows for midline-transition awareness, not as automatic trade commands.
- Use confirmed divergence as a warning that price and momentum are no longer agreeing.
- Combine the pane with price structure, risk level, liquidity, and your own execution rules.
Illustrative chart examples
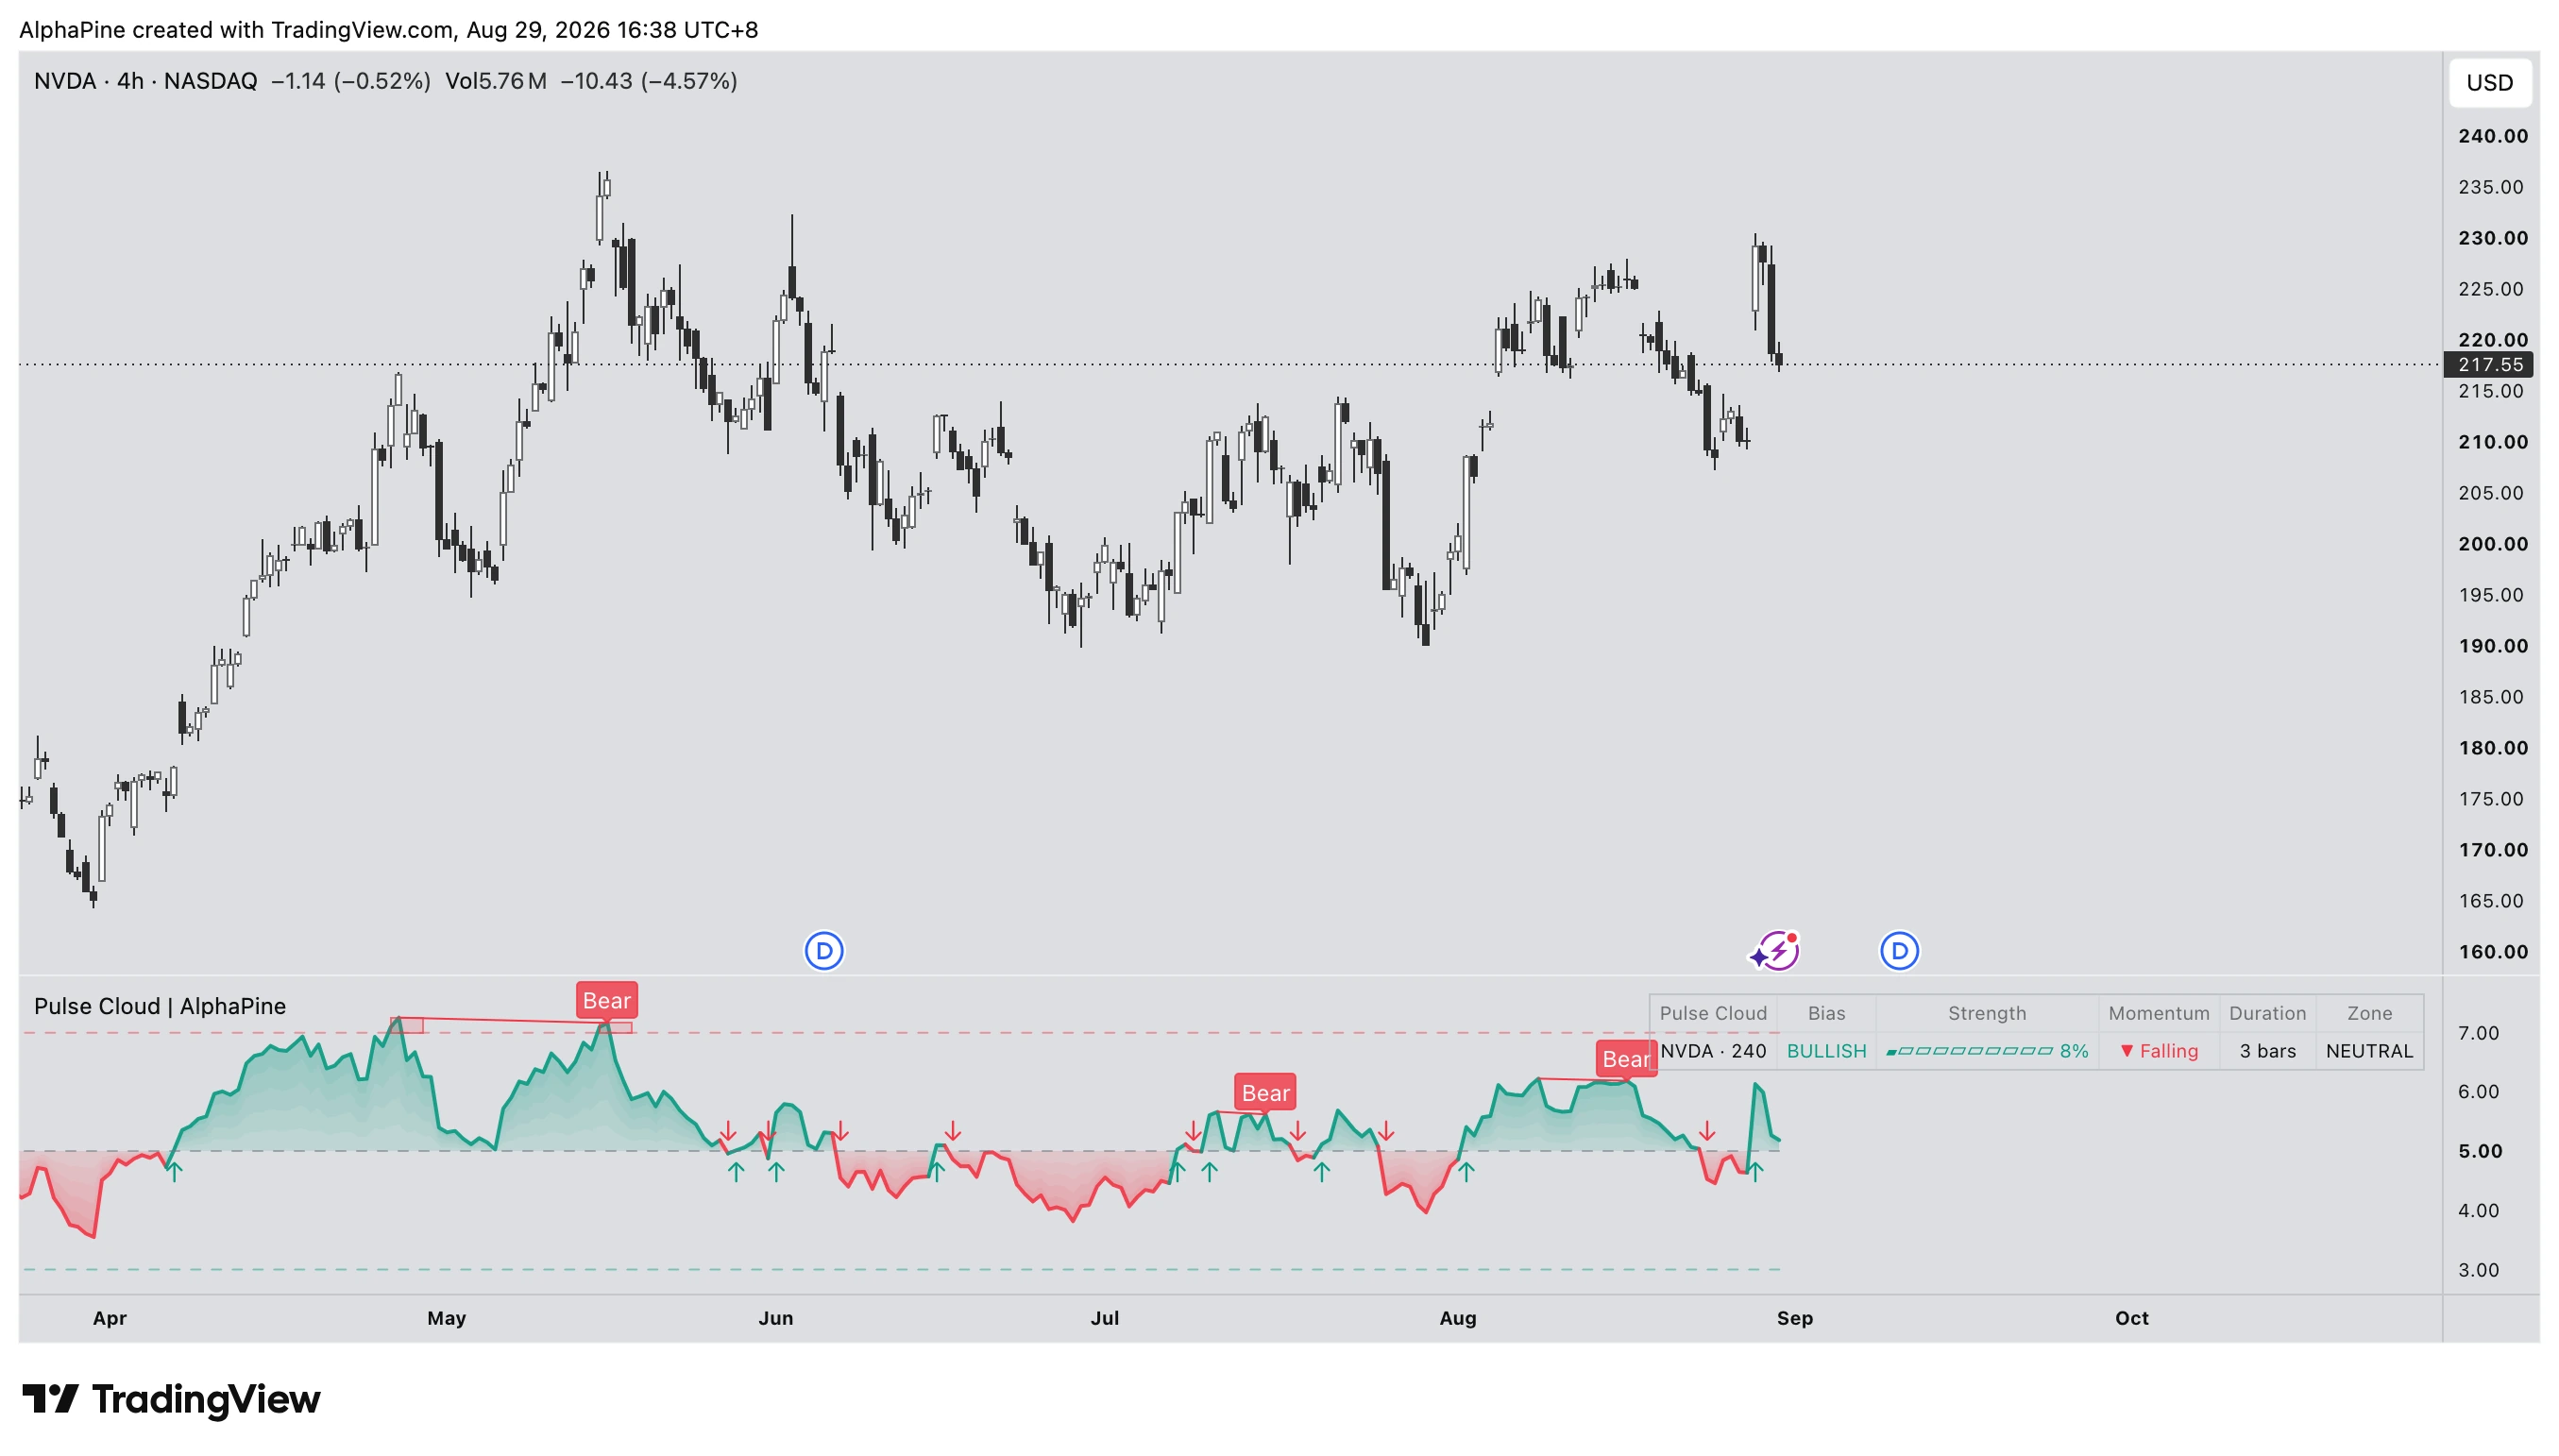
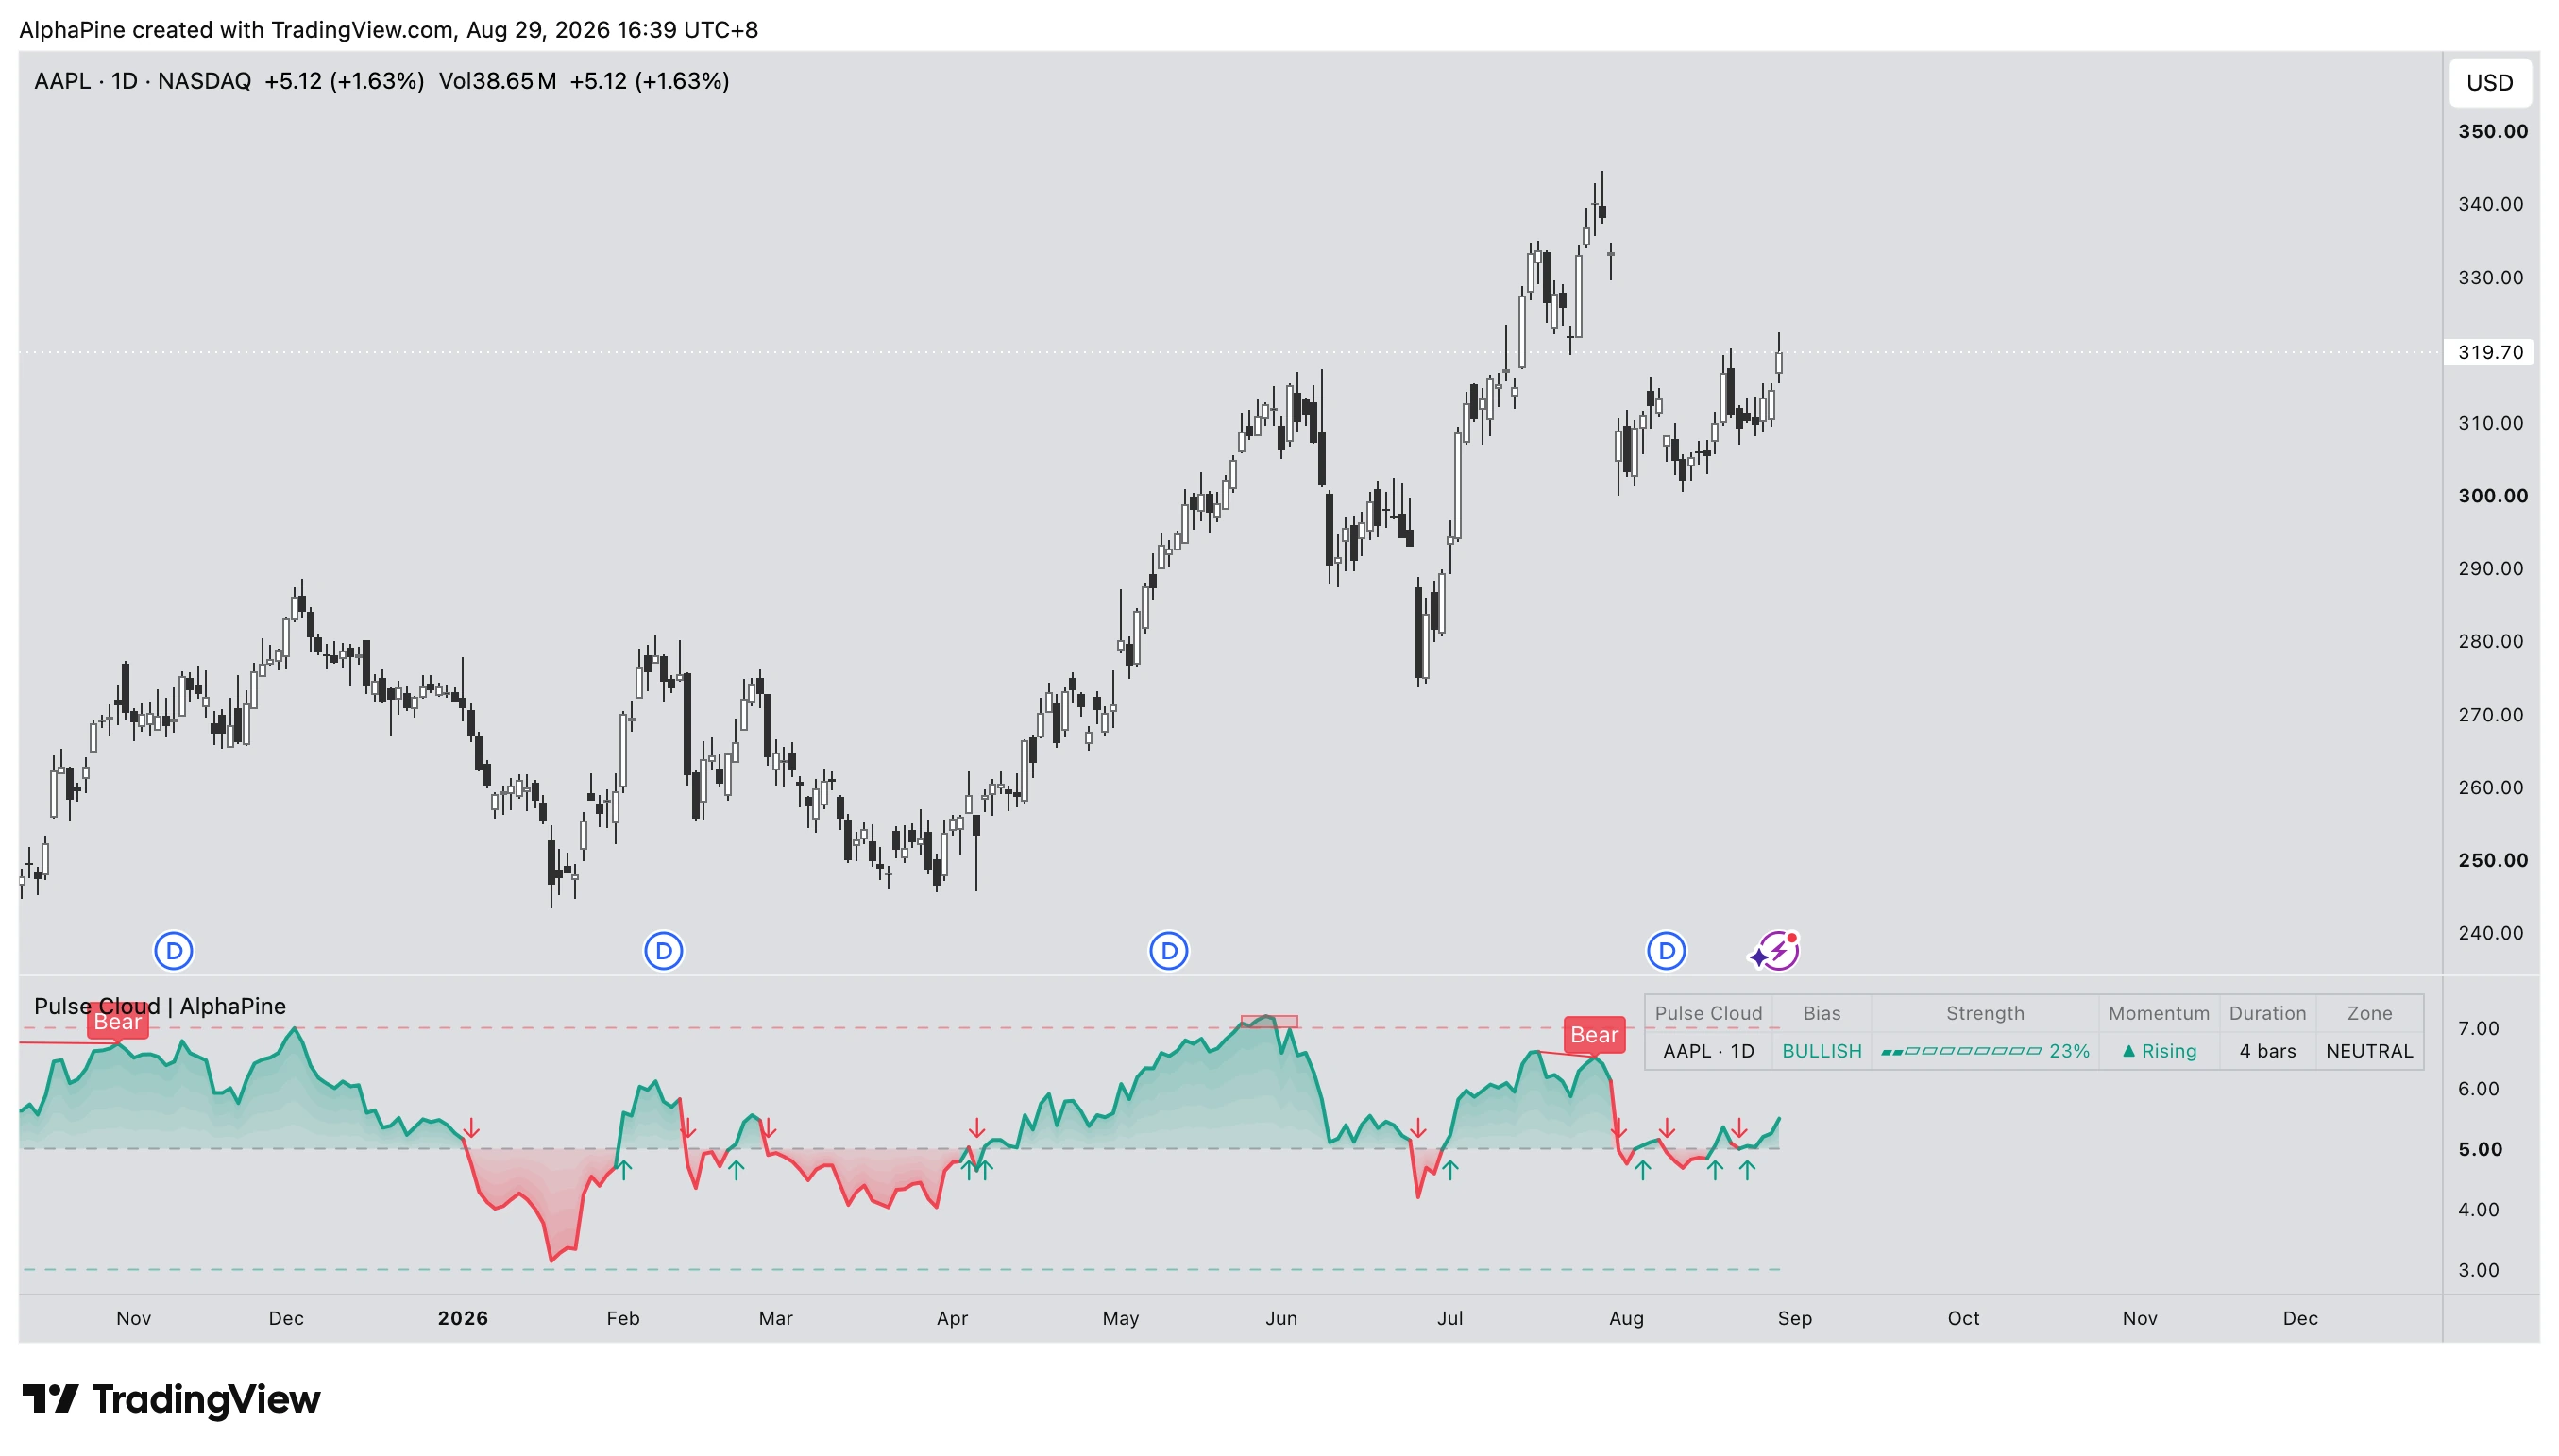
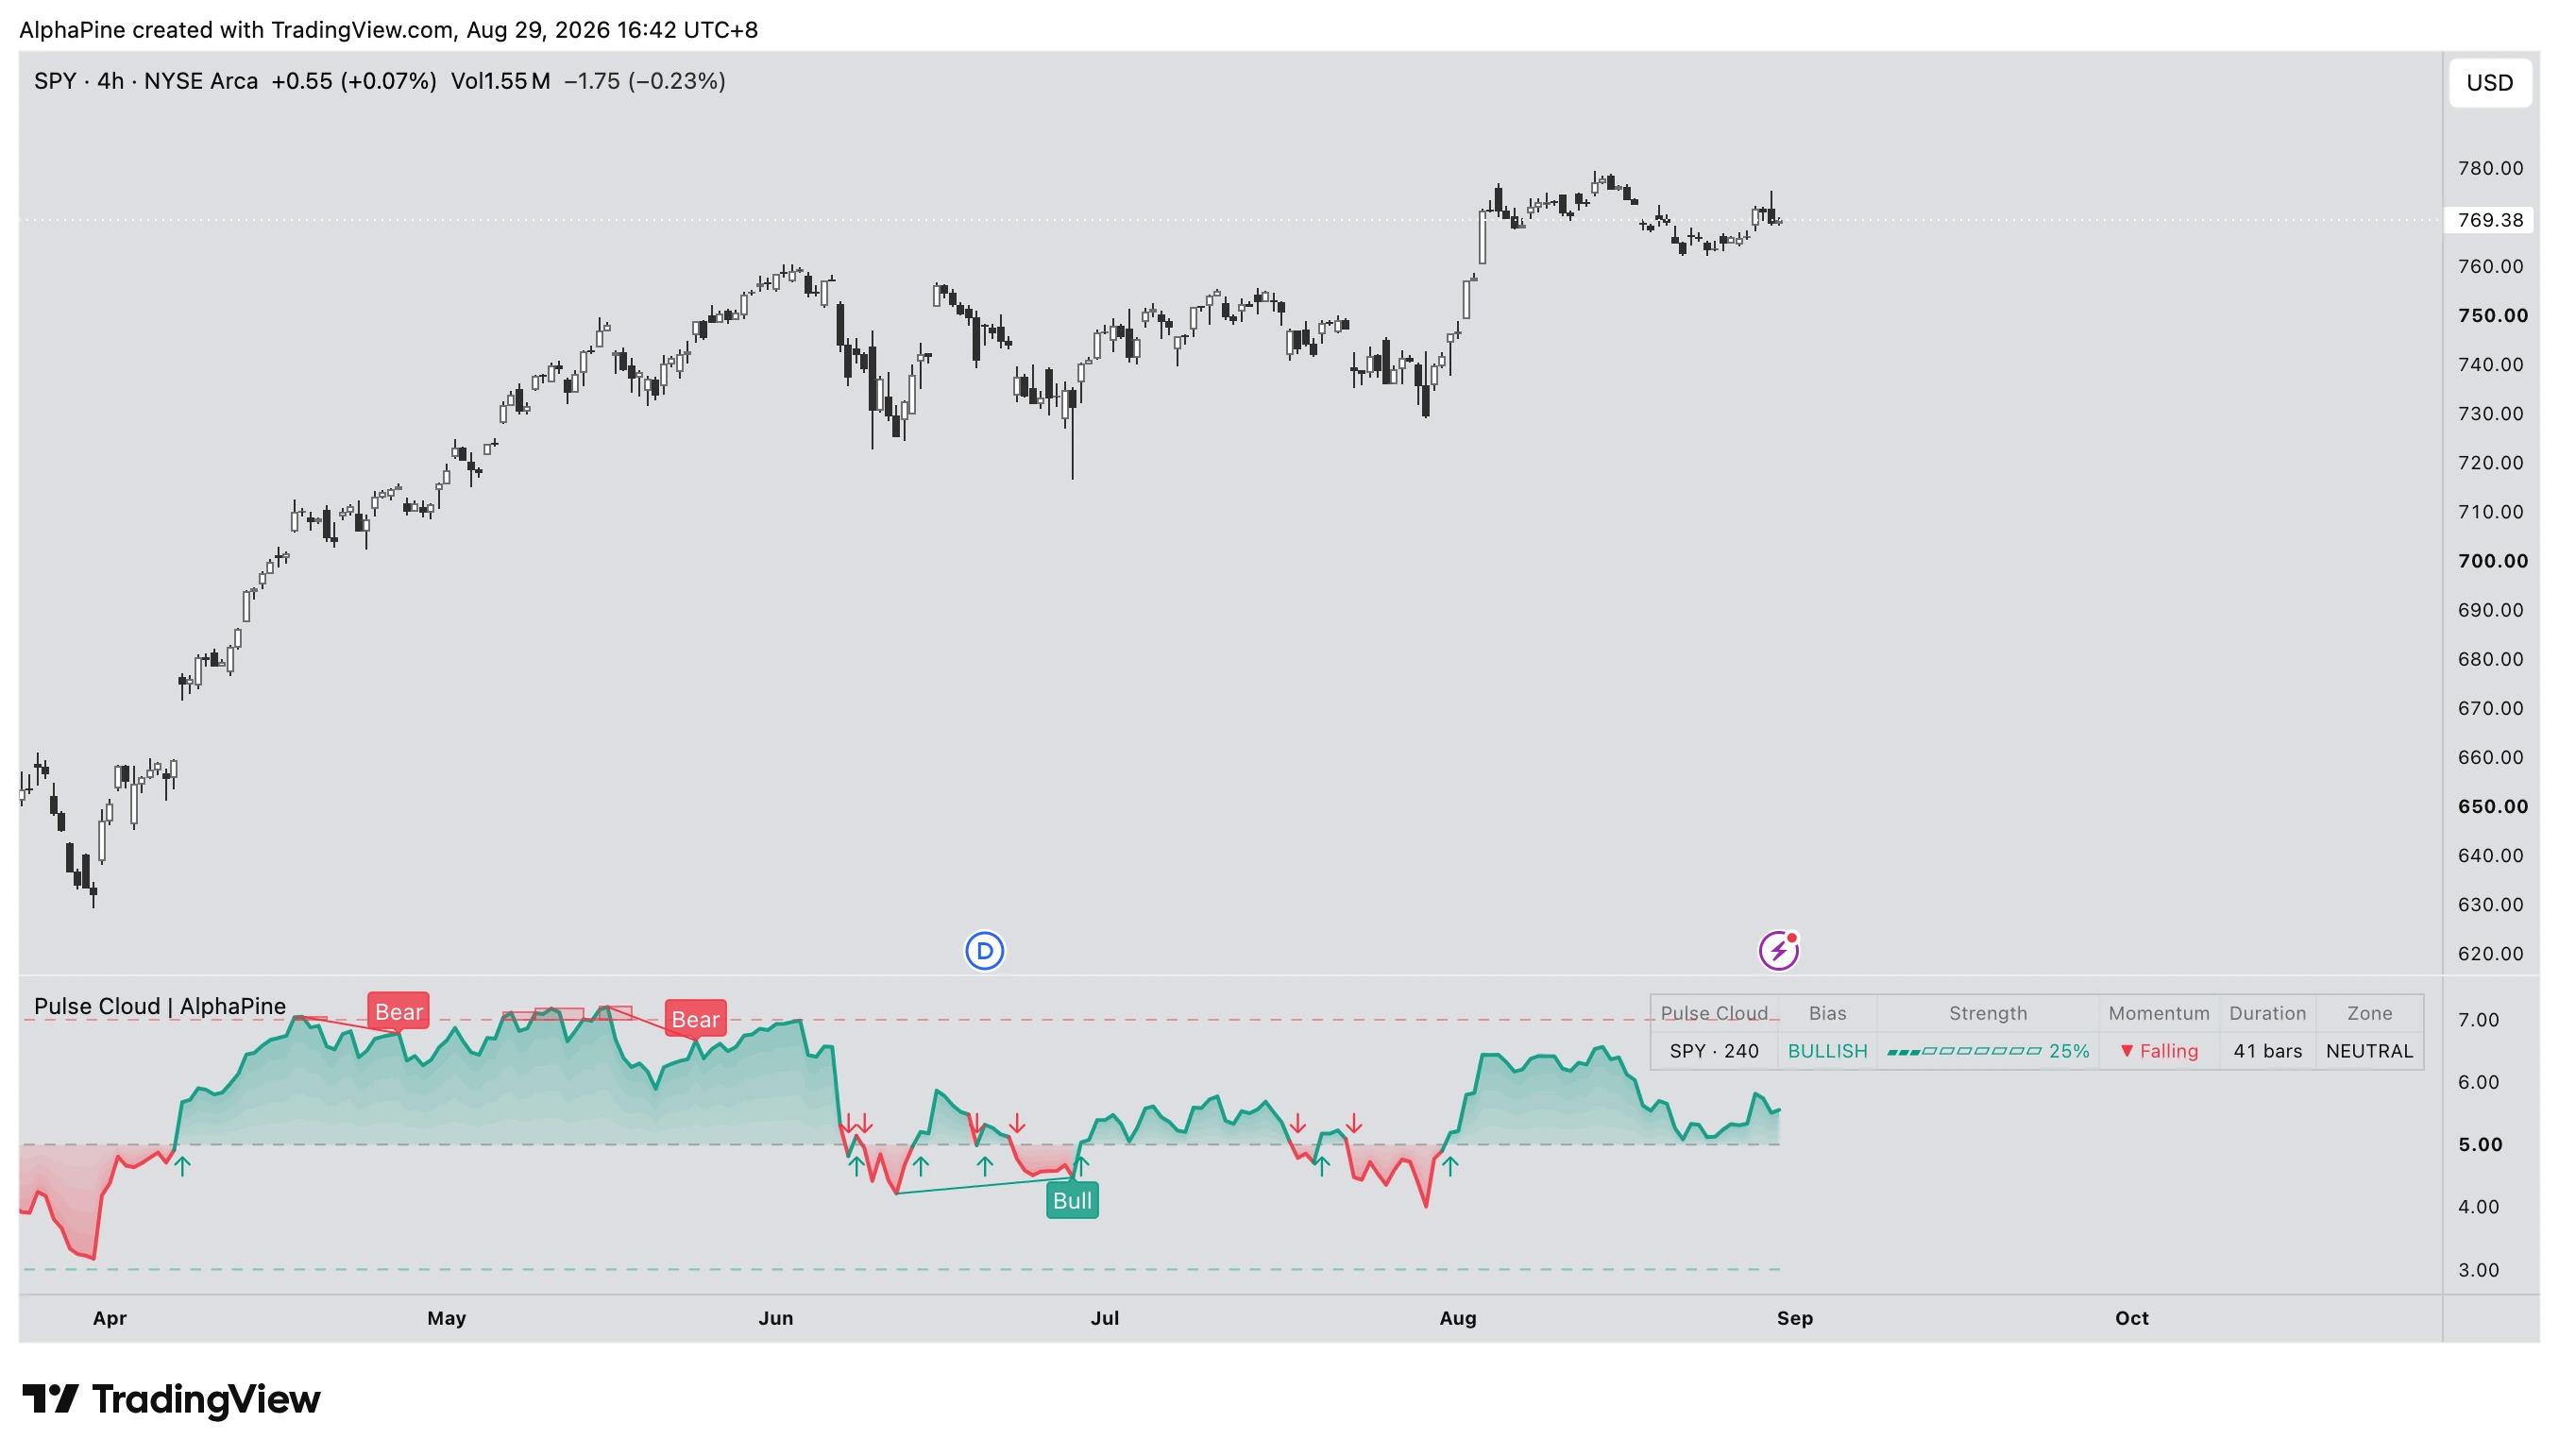
The main publication chart uses BITSTAMP:BTCUSD on the 4H timeframe to show the overall Pulse Cloud layout, including midline transitions, directional bias, and stretched-zone behaviour. The supporting stock-market snapshots below focus on specific features that may be less visible in the main chart.
These charts are intended to explain indicator behaviour across different markets. They are not evidence of signal accuracy, profitability, or future performance. Unless stated otherwise, each example should use the default Pulse Cloud settings on a standard candlestick chart, with the symbol, timeframe, and indicator name visible in the status lines.
Example 1 — NASDAQ:NVDA, 4H
Example 2 — NASDAQ:AAPL, 1D
Example 3 — AMEX:SPY, 4H
Alerts and optional webhooks
Eight standard alert conditions are available:
- Bullish and Bearish midline cross.
- Entry into Overbought and Oversold.
- Exit from Overbought and Oversold.
- Bullish and Bearish regular divergence.
Optional webhook JSON alerts cover the same eight event types. Create one TradingView alert using Any alert() function call when webhook mode is enabled. If multiple events occur together, the payload groups them in the “signals” array while retaining “signal” as the primary event for compatibility. Intrabar webhook events are deduplicated by event type on each bar.
The Alerts Require Confirmed Bar setting applies to both standard alert conditions and webhook events. Keep it enabled when downstream automation should receive only closed-candle events. When it is disabled, alerts may trigger intrabar and the final closed-bar condition may differ.
Webhook delivery does not replace order validation. Test payload parsing, duplicate handling, latency, broker constraints, and risk limits before connecting any external execution workflow.
Settings guide
Pulse Line
- Pulse Length controls the core momentum lookback. Shorter values react faster; longer values are smoother and slower.
- Source selects the price series used by the pulse.
- Smooth Pulse and Length apply optional RMA smoothing to the displayed pulse.
Signals
Show or hide arrows, choose their size, control their spacing from the midline, and choose whether they follow the displayed or raw pulse. Use larger padding when arrows feel crowded around the equilibrium line.
Zones and Boxes
Set Overbought and Oversold levels, show or hide dashed level lines, and control zone boxes, width padding, and transparency.
Divergence
Show or hide divergence and set pivot left/right lookback. Larger pivot settings produce fewer, more selective divergence labels with more confirmation delay.
Strength Meter, Table, and Colours
Strength Lookback controls the normalization window, Momentum Length controls slope sensitivity, and segment count controls the visual strength bar. Table settings control visibility, size, and position. Bullish and bearish colours apply throughout the cloud, pulse line, arrows, boxes, divergence labels, and table accents. The midline remains theme-adaptive for readability.
Data integrity and limitations
- The live pulse, cloud, table, and zone-box extent can update until the current candle closes. This is normal for a close-based oscillator.
- Midline-cross arrows are displayed on the bar where the cross is detected and are not shifted onto an earlier bar. On an open realtime bar, an arrow can still appear or disappear until the candle closes.
- Divergence labels wait for right-hand pivot confirmation. They are displayed on the earlier pivot bar for structural context, become known only on the later confirmation bar, and become final after that confirmation bar closes.
- The indicator does not use higher-timeframe requests or lookahead data.
- Overbought and Oversold are stretch conditions, not automatic reversal signals.
- This indicator is educational and analytical. It does not guarantee outcomes or replace risk management.