

Self-fulfilling markets · Part 1 of 2
The Level Is Not Magic — You Are
How shared expectations create technical levels — and why a setup can grow more reliable while its edge disappears.
An expanded version of an article first published on 24 August 2026 in AlphaPine's Ideas on TradingView.
Price falls toward a level you marked days ago. Nothing about the number looks special — it is simply where the market turned before. Then, as price approaches, the candles slow, volume picks up, and price turns almost exactly on your line. It feels as if the market respected your analysis. It did not. The market does not know your line exists. But thousands of other participants may be watching something very similar — and that changes everything.
The line has no power. The crowd does.
Imagine a widely watched support level. Some traders rest buy orders there. Short sellers take profit into it. Existing longs place stops just underneath, and breakout traders wait below those stops. Execution algorithms respond to the liquidity that begins to cluster around the area.
By the time price arrives, the level is no longer merely a drawing. It has become a place where expectations, orders and liquidity are concentrated. The line itself still has no power; the behaviour surrounding it does. That is the trading version of a feedback loop you already know:
Belief → Behaviour → Outcome → Reinforced belief
What "self-fulfilling prophecy" means here
The clearest example comes from outside markets. A rumour spreads that a healthy bank is about to fail. The rumour is false, but depositors queue anyway. Withdrawals accelerate, reserves drain — and the bank fails. The belief was wrong when it started; collective behaviour made it true.
Strictly, Robert K. Merton's original definition was that narrow: an initially false definition of a situation produces behaviour that makes the false conception come true. Markets are messier. A support level is not false before anyone acts on it — it is simply undetermined. So this article uses the term more broadly, for feedback processes in which expectations help shape the outcomes participants later observe. The distinction matters, because not every market feedback loop is a self-fulfilling prophecy in the strict sense.
Why familiar levels can matter
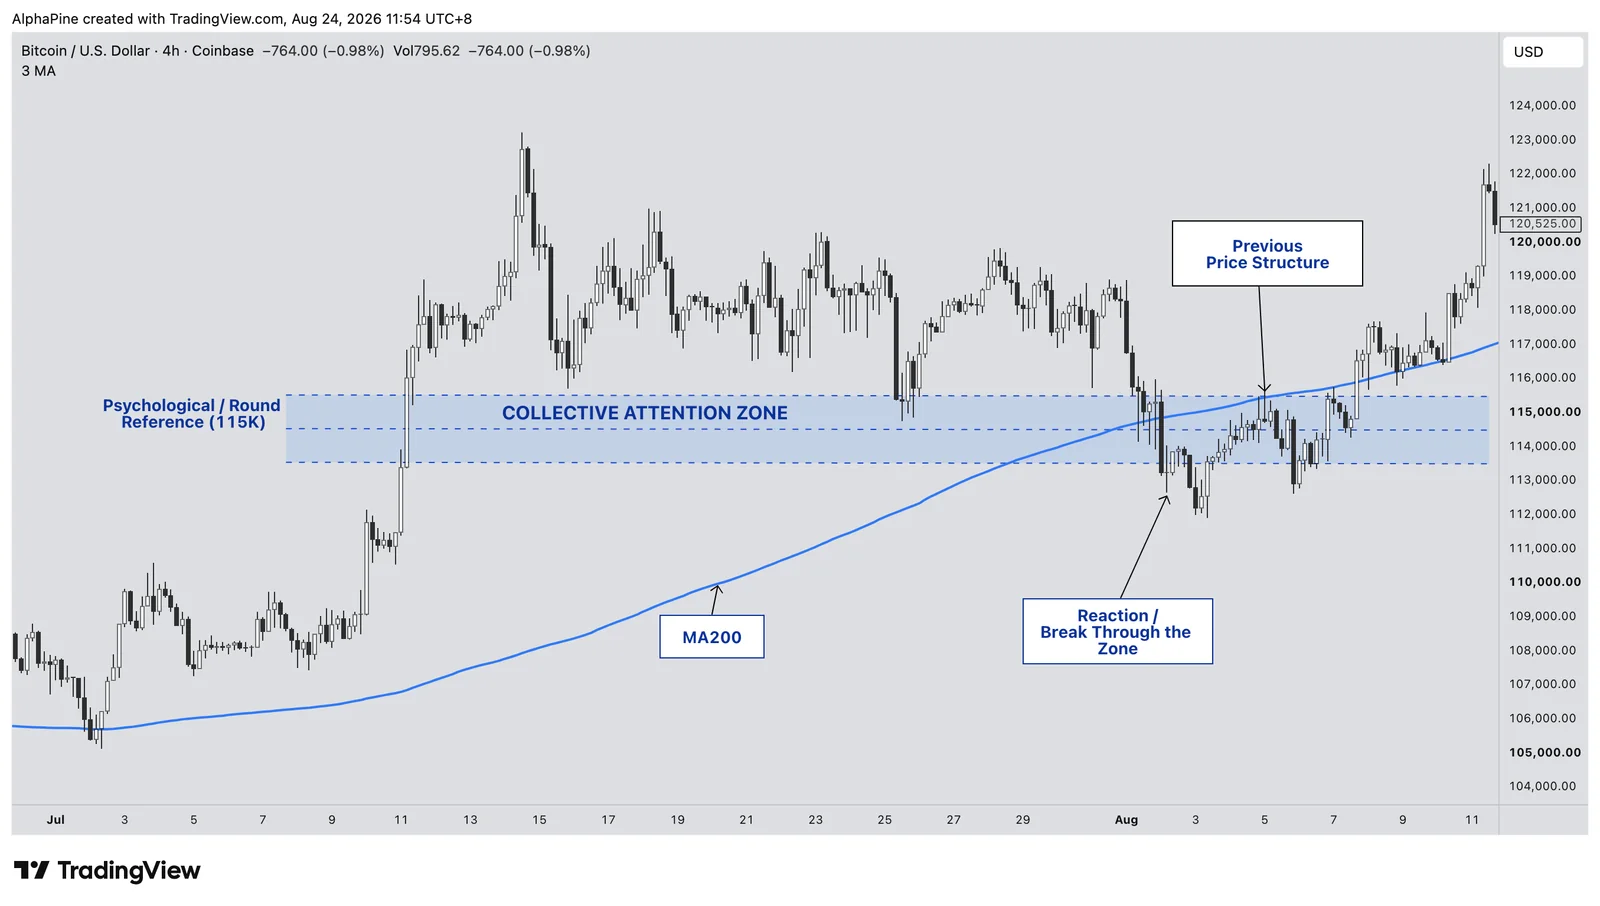
Moving averages. There is no law of nature that says 200 periods must matter while 197 or 203 must not. Yet the MA200 has become one of the most familiar reference points in technical analysis: traders watch it, portfolio managers discuss long-horizon trend measures, systematic strategies may use similar trend rules, and financial media quote it constantly. That does not prove every reaction around an MA200 is caused by its popularity. It does mean widespread observation can make it part of the behavioural environment around price.
Round numbers. Bitcoin is not fundamentally worth exactly 100,000 because the number is memorable. But people organise decisions around round numbers: alerts cluster there, profit targets cluster there, stops cluster nearby, and derivative strikes use standard, memorable increments. Liquidity can accumulate around prices that began as nothing more than human convention.
Chart patterns. A head-and-shoulders neckline is only geometry until people make decisions around it. Once it is recognised widely enough, its break can trigger exits, entries, stops and momentum responses. The pattern may appear to predict behaviour while part of that behaviour is produced by participants reacting to the pattern itself.
Confluence is not a vote count
This changes how confluence should be judged. Suppose RSI, Stochastic and Williams %R are all oversold. That looks like three confirmations, but all three are closely related momentum measurements of the same price series — one opinion counted three times.
Now compare a price zone where:
- a previous major high sits nearby,
- a psychological round number is present,
- a long-horizon moving average crosses the area,
- a previous breakout happened there, and
- derivative positioning is concentrated nearby.
That is different in kind. Each is an independent reason for a different population of participants to care about roughly the same price. Good confluence, then, is better understood as a concentration of independent expectations than as a tally of agreeing indicators.
The arithmetic of a crowded trade
If collective attention can strengthen a reaction, the most widely followed setup should be the best trade. Every experienced trader knows that is not the whole story. Some of the cleanest textbook setups are terrible trades: a level can hold repeatedly and still offer poor entries, and a breakout can succeed often yet pay almost nothing relative to the risk it needs. The question that explains it is not "how often does this work?" but "what is the trade worth?"
Expected value per trade, in units of risk, is:
EV = P(win) × R − P(loss) × 1
where R is the reward for one unit of risk. Now follow one level through four stages of adoption. The figures are deliberately illustrative — they show the mechanism, not measured market data.
| Stage | What happens | P(win) | R | EV |
|---|---|---|---|---|
| 1. Few care | Little collective flow; competition is low, entries can be early and the reward is large. | 40% | 3.0 | +0.60 |
| 2. Recognised | Orders start to concentrate; the reaction is more reliable and pricing is still attractive. | 60% | 1.8 | +0.68 |
| 3. Obvious | Participants front-run each other; price reacts before the ideal entry, so the stop stays but the reward shrinks. | 70% | 1.0 | +0.40 |
| 4. Crowded | Still behaviourally important and still "working" — but everyone wants the same position. | 75% | 0.4 | +0.05 |
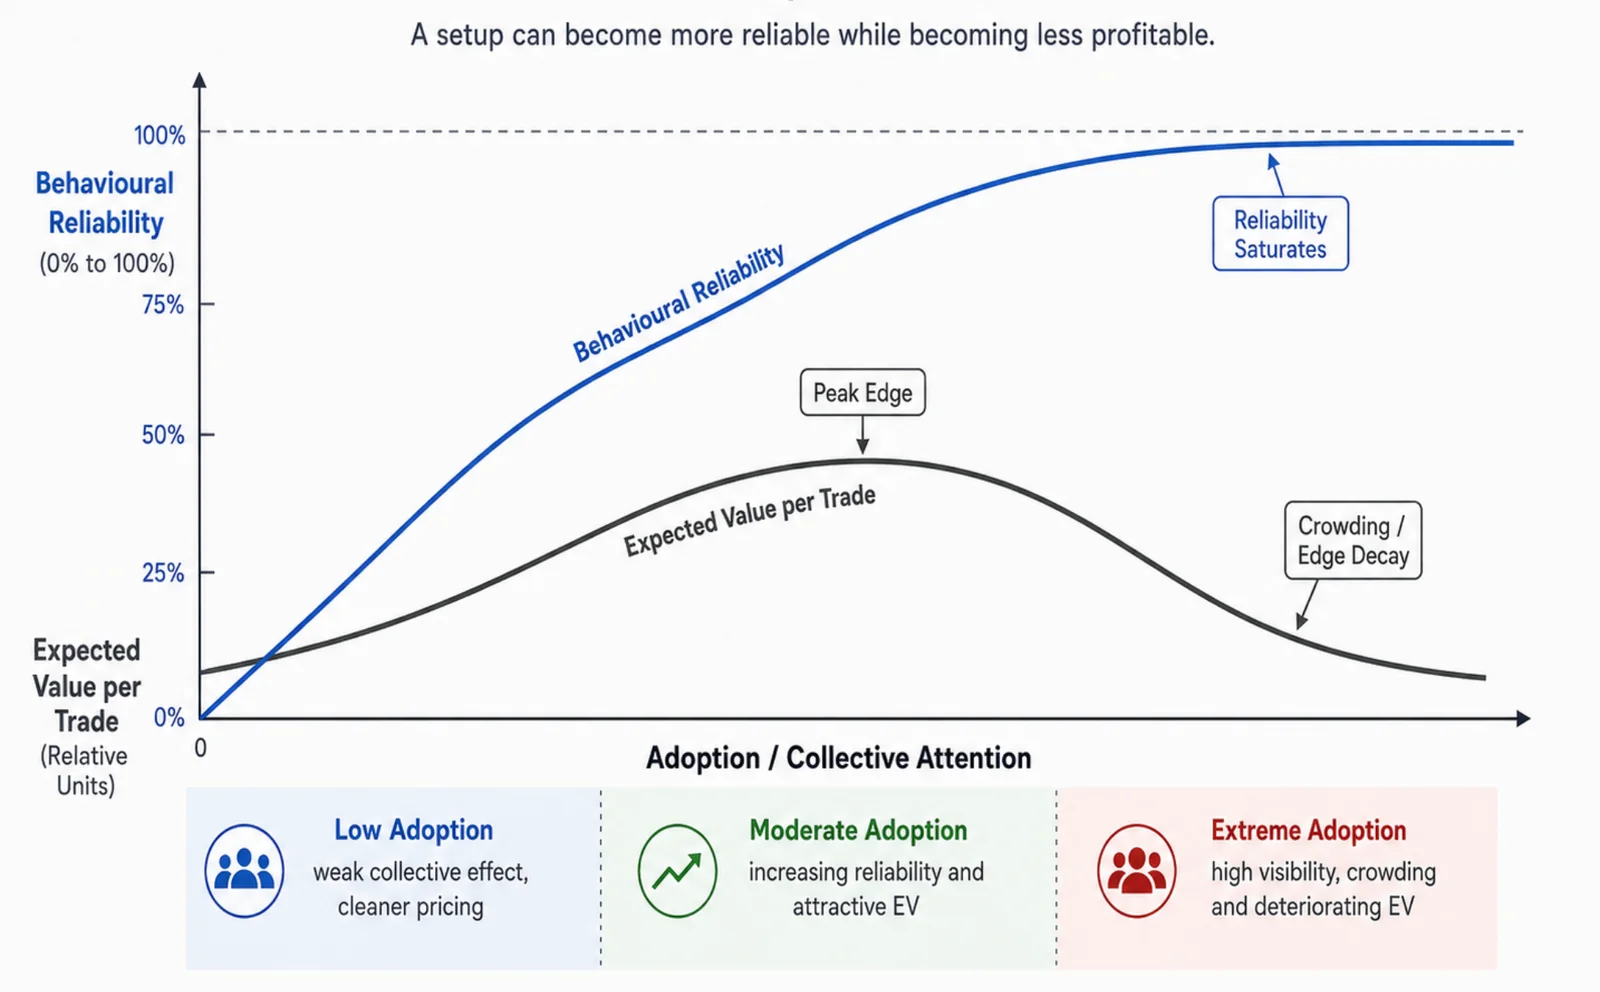
Win rate rises at every stage — 40% → 60% → 70% → 75% — while expected value peaks in the middle and then collapses: +0.60 → +0.68 → +0.40 → +0.05. By stage 4 the trade is reliable and barely worth taking.
Note how generous that example is to the crowded setup: it lets reliability keep improving all the way through stage 4. If heavy crowding also raises the risk of failed reactions — which the next section argues is plausible — P(win) falls too, and expected value decays faster than shown. The table understates the problem rather than exaggerating it.
Nothing here requires the level itself to become less reliable. The opportunity can disappear simply because the price of participating gets worse. That is the central distinction: market impact and trading edge are not the same thing. A technical phenomenon can grow more important behaviourally while growing less attractive to trade.
Popularity also creates predictability
When a setup becomes obvious, the behaviour around it becomes easier to anticipate. Around a support level everybody sees, buyers are likely to sit near it, long stops underneath it, and breakout sellers below those stops. The individual orders are invisible to most participants, but where they probably sit is no longer much of a mystery.
Predictable order concentrations are liquidity, and liquidity is useful to anyone who needs to transact size. None of this requires a story about a giant institution personally hunting retail stops. Participants who need liquidity simply prefer the places where others are likely to trade:
Popularity → Shared reference → Concentrated orders → Predictable positioning
The same crowd that makes a level behaviourally relevant can make trading it increasingly competitive.
The second-order game
John Maynard Keynes compared investing to a newspaper beauty contest in which the winner is not the one who picks the face they find most attractive, but the one who best anticipates what everyone else will pick. Trading often works the same way.
- First-order: "Is this support level good?"
- Second-order: "How many other people think this support level is good?"
- Deeper still: "What will others do because they expect everyone else to react there?"
At that point you are no longer only analysing price; you are analysing expectations about expectations. George Soros approached the same family of problems as reflexivity: participants' perceptions affect their behaviour, their behaviour affects market outcomes, and those outcomes feed back into perception. The market is not simply being observed — its observers help create the next observation.
What to take to your own charts
- Ask who is behind the level, not whether it is "valid". List the independent reasons different participants have to trade at that price. Three momentum oscillators agreeing is one reason, not three.
- Judge the trade by R, not by how often the level holds. Put the stop where the idea is invalidated and see what reward is actually left. A crowded level often leaves a 0.5R trade dressed up as a high-probability one. The position size calculator shows the planned R:R and the real risk after rounding before you place the order.
- Treat obviousness as information. A famous level can attract more genuine flow and more competition at the same time. Expect earlier reactions and worse fills, and plan for them.
- Keep score by expectancy. Record each setup and compare them by average R per trade, not win rate. A setup whose win rate climbs while its average R shrinks is showing you stage 3 or 4 of the table above.
Next: when belief becomes obligation
So far every action in the story has been a choice: a trader sees support and chooses to buy; a fund sees a trend and chooses to join it. But markets contain another kind of behaviour. A position creates an exposure; the exposure creates a hedge. A mandate creates a rebalance. A risk limit forces deleveraging. A margin call creates an exit. At that point the person sending the order does not need to believe in the original level at all — the behaviour has been built into a mechanism.
Part 2 follows that transition — from expectation, to position, to constraint, to mandatory flow.
The numerical examples are illustrative and demonstrate expected-value mechanics; they are not estimates of real-world strategy performance. This article is for education only and is not financial advice.