

Self-fulfilling markets · Part 2 of 2
When Belief Becomes Obligation
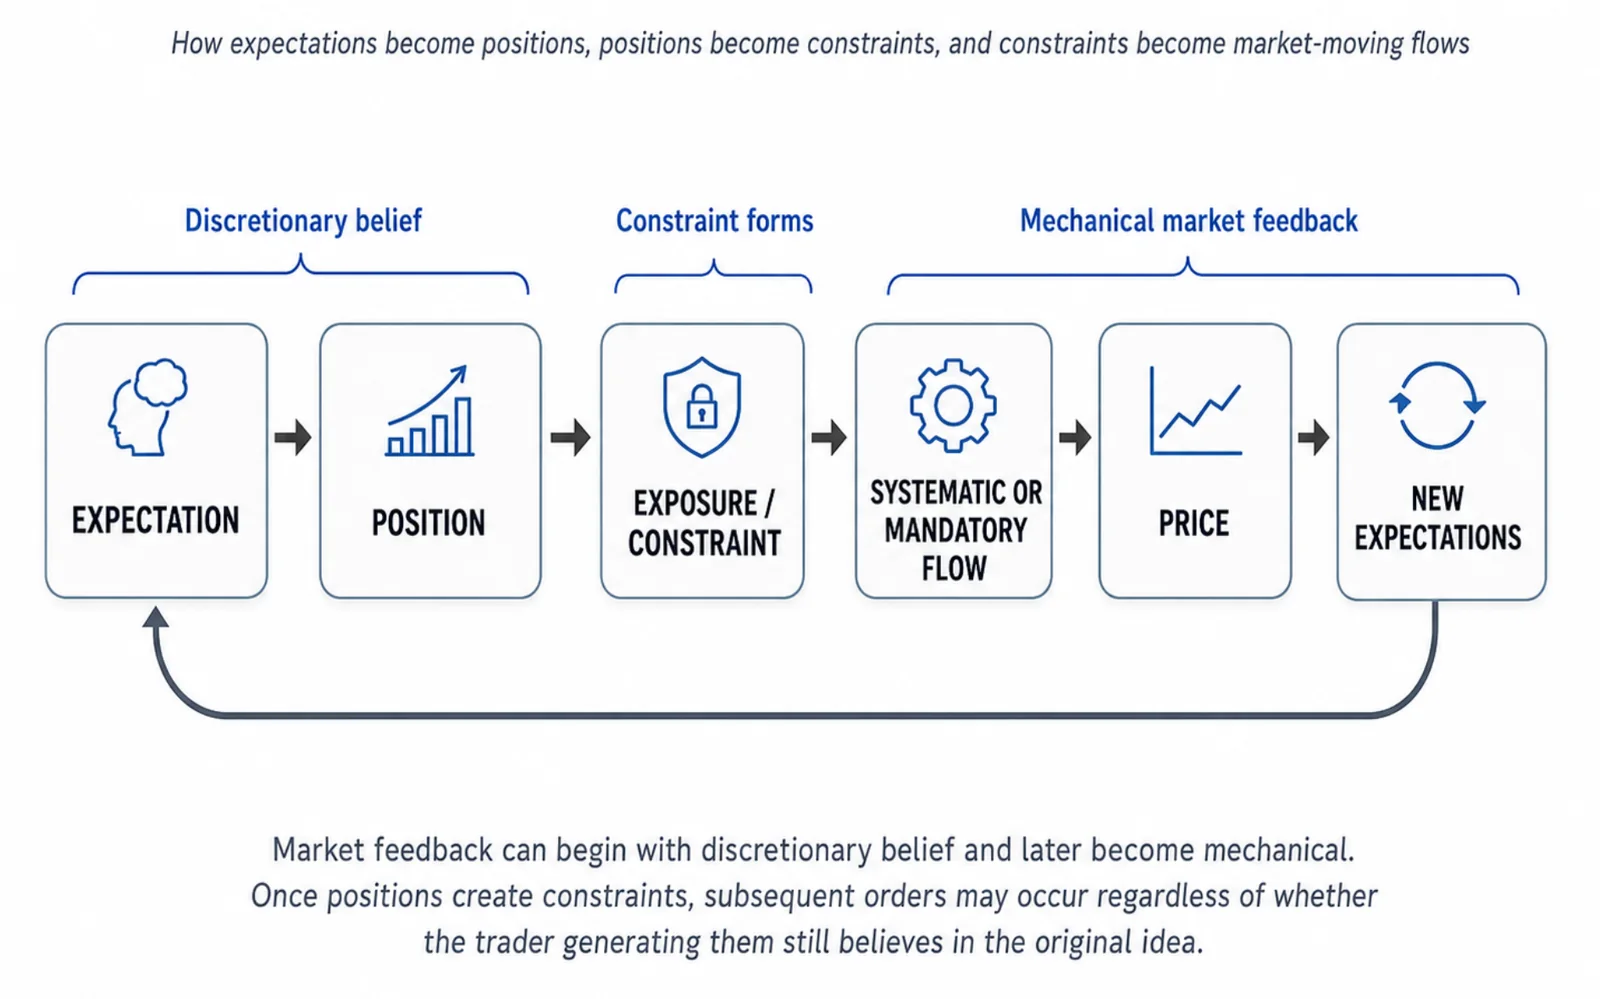
How expectations become positions, positions become constraints, and constraints become market-moving flows.
An expanded version of an article first published on 29 August 2026 in AlphaPine's Ideas on TradingView.
Part 1 started with a simple idea: a level can matter because enough participants behave as if it matters. That is only the start of the loop. Once a belief creates a position, the next trade may no longer depend on belief at all. An option position creates hedging needs. An index mandate requires rebalancing. A systematic strategy fires when its rules trigger. Leverage can force liquidation. The original expectation has become something more durable: an obligation to transact.
From belief to structure
Consider the sequence:
Expectation → Position → Exposure / constraint → Systematic or mandatory flow → Price → New expectations
The person executing the last trade in that chain may have no opinion about the market at all. A dealer rebalancing delta is not necessarily bullish. An index tracker buying a newly included stock is not necessarily optimistic about the company. A fund cutting risk after a volatility shock may still believe the asset is cheap. Their orders happen because something upstream has constrained their choices.
In Merton's strict sense, not every loop described here is a self-fulfilling prophecy; some are better called mechanical feedback generated inside the market. The label matters less than the mechanism: a belief creates a position, the position creates exposures or constraints, and those generate future obligations that can amplify, dampen or reshape the price behaviour participants later observe. Behaviour crystallises into market structure — and the structure can outlive the belief that built it.
1. The dealer: when a position creates a hedge
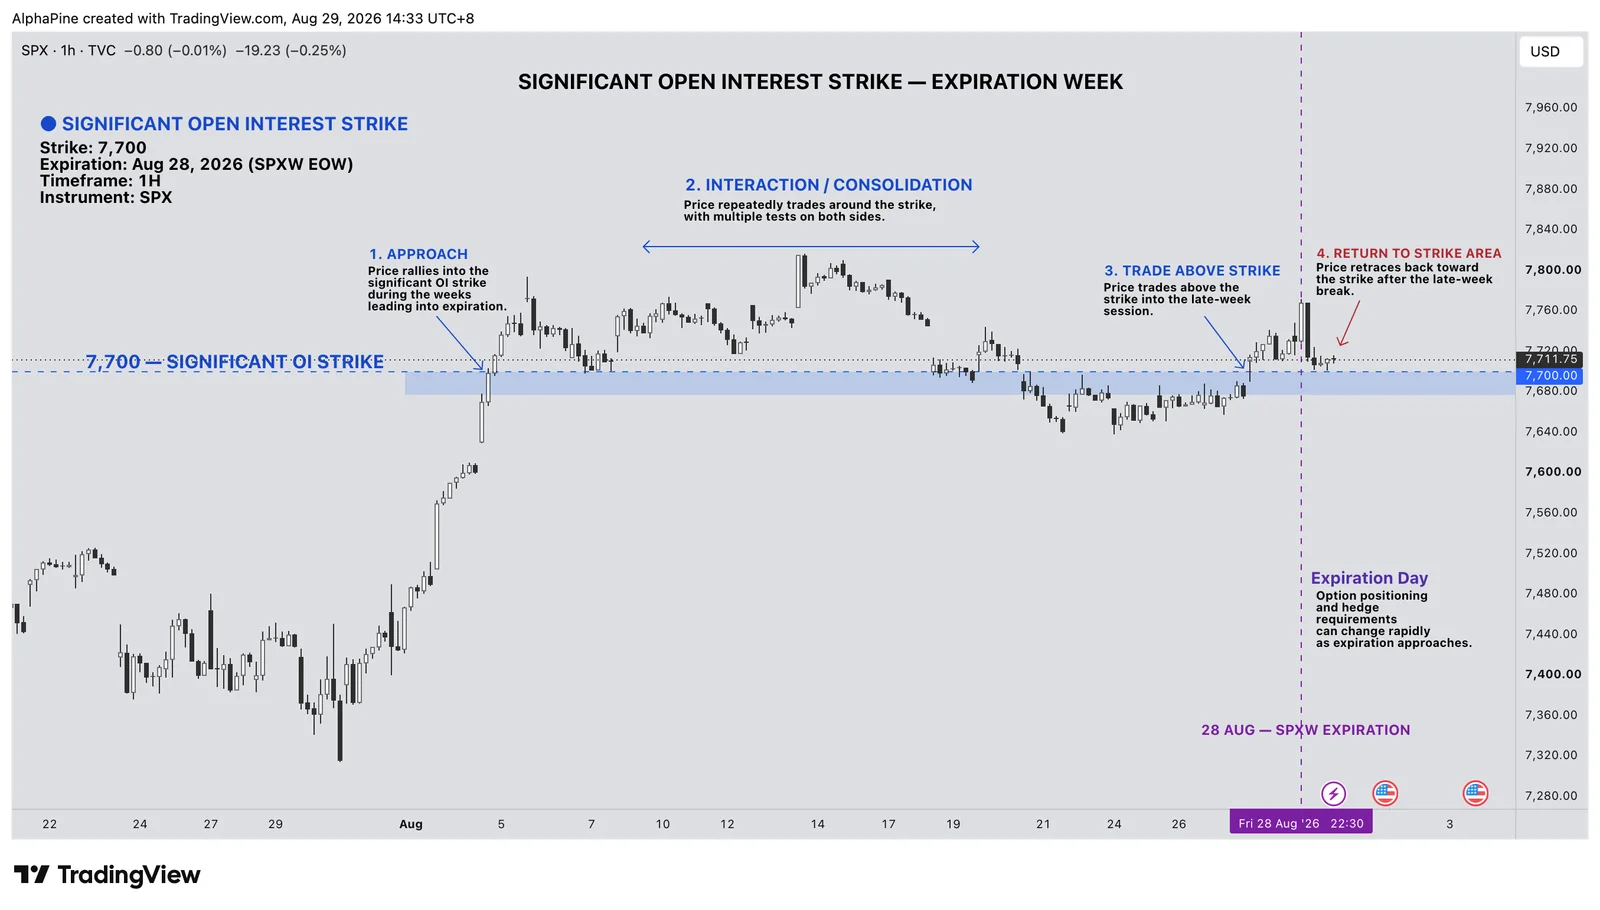
Options give one of the clearest examples. When an options market maker takes the other side of customer flow, the resulting book can carry directional and convexity exposure, and dealers commonly hedge part of it in the underlying. As price moves, the required hedge changes — a feedback link:
Option position → Underlying price → Hedge requirement → Underlying trading
The direction of that link is what matters:
Price rises → the hedge requires selling. Price falls → it requires buying. Rebalancing leans against the move and can dampen it.
Price rises → hedging can require buying. Price falls → it can require selling. Rebalancing leans with the move and can amplify it.
So a strike is not automatically a "magnet", and dealer hedging does not automatically produce mean reversion. The effect depends on the sign, size and distribution of aggregate exposure.
This is measurable. Ni, Pearson and Poteshman documented that on option expiration dates, the closing prices of optionable stocks cluster around strike prices more often than chance would explain; their 2005 study estimated option-related effects altered returns by at least 16.5 basis points on average per expiration date — aggregate market-capitalisation shifts on the order of US$9 billion in their sample. Later work by Ni, Pearson, Poteshman and White found a broader link between option hedge rebalancing and underlying volatility, with roughly 12% of daily absolute returns in optioned stocks associated with hedge rebalancing, including outside expiration week.
The point is not that options "cause support and resistance". The narrower and more useful conclusion: derivative positions can create mechanical flows in the underlying market with measurable effects on price. That matters more where short-dated options dominate. In 2025, SPX zero-day-to-expiry options averaged around 2.3 million contracts a day — roughly 59% of SPX options volume — and in February 2026 Cboe reported a record 2.99 million a day, 63% of all SPX trading, with 0DTE activity still elevated through the second quarter of 2026. None of that tells you tomorrow's direction. It tells you that ignoring how derivative exposure interacts with underlying order flow means ignoring part of the market's structure.
2. When many systems react to the same information
Not every mechanical flow comes from derivatives. Systematic strategies create another kind of coordination, and the scale is not marginal: industry estimates, based on BarclayHedge data, put managed-futures assets at roughly US$340 billion. That is an industry estimate rather than a peer-reviewed figure, but it shows rule-driven capital in futures is large.
Trend followers use moving-average relationships, breakouts, time-series momentum, volatility scaling, or blends across horizons. The models differ, and there is no evidence that "the MA200" is some universal institutional trigger. But when several independent models detect a strengthening trend at about the same time, their orders can become correlated although the managers never coordinated. Nobody needs to call anyone. Similar data plus similar objectives can be enough.
Add risk scaling and another loop appears: a market falls sharply, volatility rises, target exposure falls, positions are cut, and the selling adds to the move — raising volatility again. The model does not need to "believe" anything. Discretion has been delegated to a rule.
3. Index funds: obligation — and adaptation
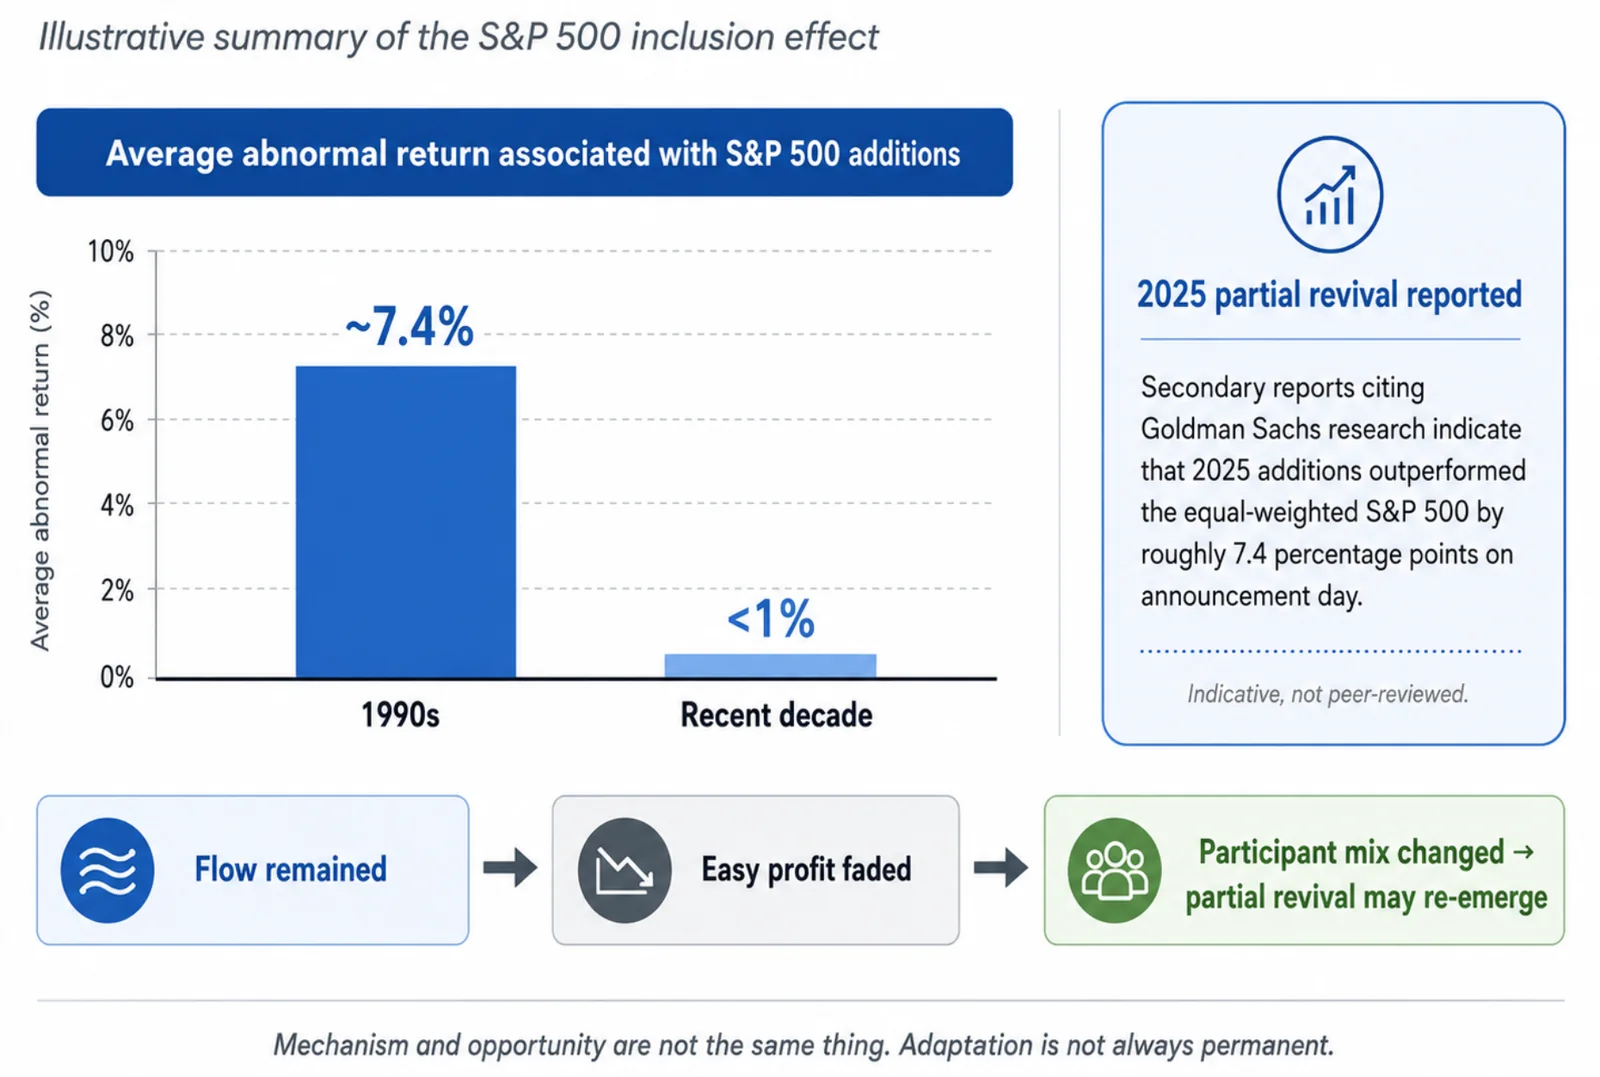
Index changes are an unusually clean experiment. When a stock enters a major benchmark, passive funds tracking it must eventually own it at the required weight — a predictable demand shock. For decades, stocks added to the S&P 500 showed large positive abnormal returns around inclusion.
Robin Greenwood and Marco Sammon examined how that changed. In their published results, the average abnormal return associated with S&P 500 additions was around 7.4% in the 1990s; over the most recent decade of their sample, it fell below 1%. What did not disappear matters more: indexing did not disappear, the obligation to track did not disappear, and the capital tied to the index did not collapse. The flow remained. The easy profit in anticipating it faded, because markets adapted — offsetting flows from other indices, better liquidity provision, and arbitrageurs who learned to build inventory before the forced buyers arrived and supply it when they did.
Adaptation is not necessarily the end. Secondary reports citing Goldman Sachs research indicate the inclusion effect has partly returned, with 2025 additions outperforming the equal-weighted S&P 500 by roughly 7.4 percentage points on announcement day — a revival those reports largely attribute to heavier retail participation in a few high-profile names. That comes from reporting on a bank research note, not a peer-reviewed study, so treat it as indicative. The implication is what counts: an edge that looked competed away can re-emerge when the participant mix changes.
That is the cleanest form of the paradox: a mechanism can stay economically real while the edge in forecasting it disappears — and whether it disappears depends on who is participating.
4. When sophisticated strategies become the crowd
Crowding is not a retail problem. In the week of 6 August 2007, a number of quantitative long/short equity funds took extraordinary losses while broad indices did not suffer anything comparable. Khandani and Lo found evidence consistent with deleveraging across similarly built portfolios. The funds did not need identical code: different teams using similar academic factors, optimisation methods, risk controls, liquidity assumptions and data could converge on correlated positions independently.
In their simulation, the three-day cumulative loss of roughly −6.85% was about 12 daily standard deviations of the strategy's own history, and the rebound day about 11.4 in the other direction. Those "sigma" figures are not literal normal-distribution probabilities — returns are not normal in the tails — but they show how far outside its own behaviour the episode was. Once losses began, one participant's deleveraging moved prices against others holding similar books; their risk rules then required cuts, which moved prices further.
The crowd was not a thousand beginners drawing the same trendline. It was sophisticated capital arriving independently at similar portfolios. Coordination does not require communication — sometimes competence itself converges.
5. The discretion spectrum
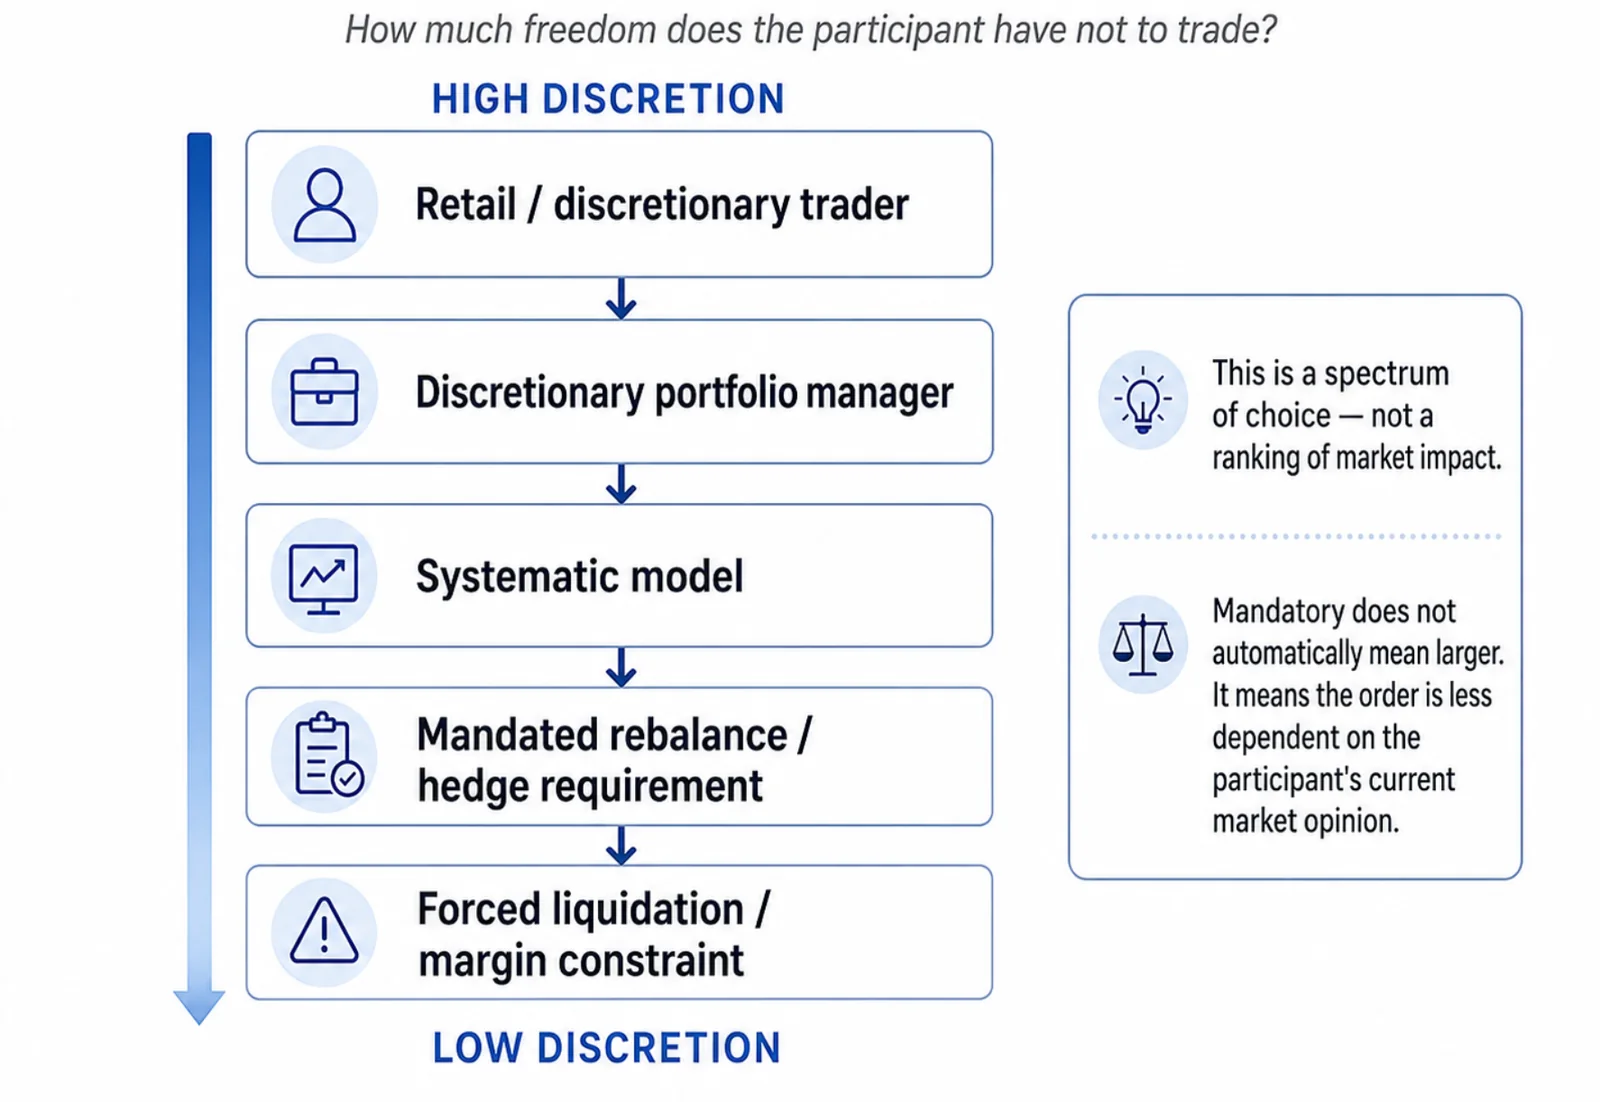
Part 1 was about belief. But orders sit on a spectrum of discretion:
- High discretion. A trader sees a chart and chooses whether to act.
- Discretionary institutional. A portfolio manager acts within a mandate but keeps real judgement.
- Systematic. The design was discretionary; day-to-day decisions are delegated to rules.
- Mandated / constraint-driven. Index tracking, hedge rebalancing, collateral requirements, margin calls and some risk limits leave progressively less freedom over whether an order happens.
This is not a ranking of price impact. A small mandatory trade can matter less than a huge discretionary one, and a concentrated retail flow in an illiquid asset can overwhelm institutional flow; impact depends on size, urgency, liquidity and conditions. The spectrum answers a different question: how much freedom does the participant have not to trade? The less discretionary the flow, the less the participant's current opinion matters.
6. When behaviour becomes structure
Back to the round number from Part 1. Why might a round price keep mattering decade after decade? If popularity necessarily destroyed the phenomenon, persistent clustering around round numbers — documented repeatedly across markets and decades — would be hard to explain. The missing distinction is between mechanism and edge.
A human preference for simple numbers influences where orders go. Over time those repeated preferences can coincide with exchange conventions, derivative strikes, liquidity habits, execution logic and market-making behaviour, until the behaviour is partly embedded in the infrastructure. Later participants no longer need to think "100,000 is psychologically important". They may simply respond to liquidity already sitting there, derivative exposure already concentrated there, risk models referencing nearby prices, or others already reacting to the area.
That does not mean every round number or technical level is secretly driven by institutional mechanics. The claim is narrower: shared behavioural conventions can sometimes become embedded in structures that then generate flows of their own. That is a hypothesis to test, not a universal explanation.
7. The paradox returns
Part 1 showed that behavioural reliability and trading EV are different things. Part 2 shows why that survives even when large institutional flows are involved. A mechanism can grow larger, more regular, better understood and more deeply embedded while the profit from anticipating it shrinks. Index inclusion is the cleanest case: the forced buying still happens, competitive markets learned to prepare for it, and the announcement-day premium largely disappeared — until a change in who was participating brought part of it back. Option hedging is another: the mechanism is not going away, and in some markets its footprint may be growing, but knowing gamma hedging exists is not an edge when everyone else knows it too.
So the adoption cycle is not popularity → effect → effect disappears. It is closer to:
Discovery → Adoption → Structural embedding → Predictability → Adaptation
Adaptation does not necessarily erase the mechanism. It erases — or redistributes — the easy profit from anticipating it. The flow can remain; what disappears is your advantage in arriving before everyone else. And adaptation is not always permanent: when the participant mix changes, an edge that was competed away can partly return. Revival is not guaranteed, and many anomalies never come back.
What this changes for a trader
- Stop treating every reaction as proof the line predicts. The chart shows the outcome; it does not show the cause.
- Ask who might be active around the level. Traders choosing to transact? Systematic models likely to respond? Meaningful derivative positioning? A scheduled rebalance or expiration? Risk constraints likely to bind?
- Separate reliability from payoff. A setup that works 75% of the time can be worse than one that works 45% of the time if the first has been competed into poor reward-to-risk. Check the R you are really getting — the position size calculator shows it after rounding — and compare setups by average R, not win rate.
- Treat obviousness as information. A famous level can attract more genuine flow and more competition at once. Both can be true.
- Look for where voluntary attention meets non-discretionary flow. Some of the most consequential zones may be where what traders choose to watch overlaps with where others have structural reasons to transact — not because those zones are magic, but because several mechanisms converge on the same price.
The final point
Part 1 began with a line on a chart. Part 2 ends with a market structure. Between them sits the whole loop:
Belief → Position → Constraint → Flow → Price → New belief
Somewhere along that chain, choice can become obligation. Later, obligation can become predictable. Once predictable, competition can remove the easy edge without removing the mechanism. So the lesson is neither "technical analysis works because everybody believes in it" nor "institutions secretly create every support and resistance level". It is this: beliefs can create positions, positions can create constraints, and constraints can generate flows that stay economically real long after the easy edge in anticipating them has been competed away — and if the participants change, part of that edge may return, or it may not.
Part 1 ended on one distinction: market impact and trading edge are not the same thing. Part 2 ends on its final form: the mechanism and the opportunity are not the same thing.
Sources and further reading
- Merton, R. K. — work on the self-fulfilling prophecy.
- Keynes, J. M. (1936) — The General Theory of Employment, Interest and Money, Chapter 12.
- Soros, G. — writings on reflexivity and fallibility in financial markets.
- Ni, S. X., Pearson, N. D. & Poteshman, A. M. (2005) — "Stock Price Clustering on Option Expiration Dates", Journal of Financial Economics, 78(1), 49–87.
- Ni, S. X., Pearson, N. D., Poteshman, A. M. & White, J. (2021) — "Does Option Trading Have a Pervasive Impact on Underlying Stock Prices?", Review of Financial Studies, 34(4), 1952–1986.
- Khandani, A. E. & Lo, A. W. (2011) — "What Happened to the Quants in August 2007? Evidence from Factors and Transactions Data", Journal of Financial Markets, 14(1), 1–46.
- Greenwood, R. & Sammon, M. (2025) — "The Disappearing Index Effect", Journal of Finance, 80(2), 657–698.
- Cboe Global Markets — SPX and 0DTE options volume statistics.
- Managed-futures industry asset estimates — industry sources based on BarclayHedge data.
- Index-inclusion revival figures — secondary reporting citing Goldman Sachs Global Investment Research.
This article is for education only and is not financial advice. Empirical figures refer to the cited research samples and should not be read as universal estimates for all securities, periods or market regimes.